Apache vs Salvadoran 9th Grade
COMPARE
Apache
Salvadoran
9th Grade
9th Grade Comparison
Apache
Salvadorans
94.3%
9TH GRADE
4.2/ 100
METRIC RATING
230th/ 347
METRIC RANK
89.6%
9TH GRADE
0.0/ 100
METRIC RATING
342nd/ 347
METRIC RANK
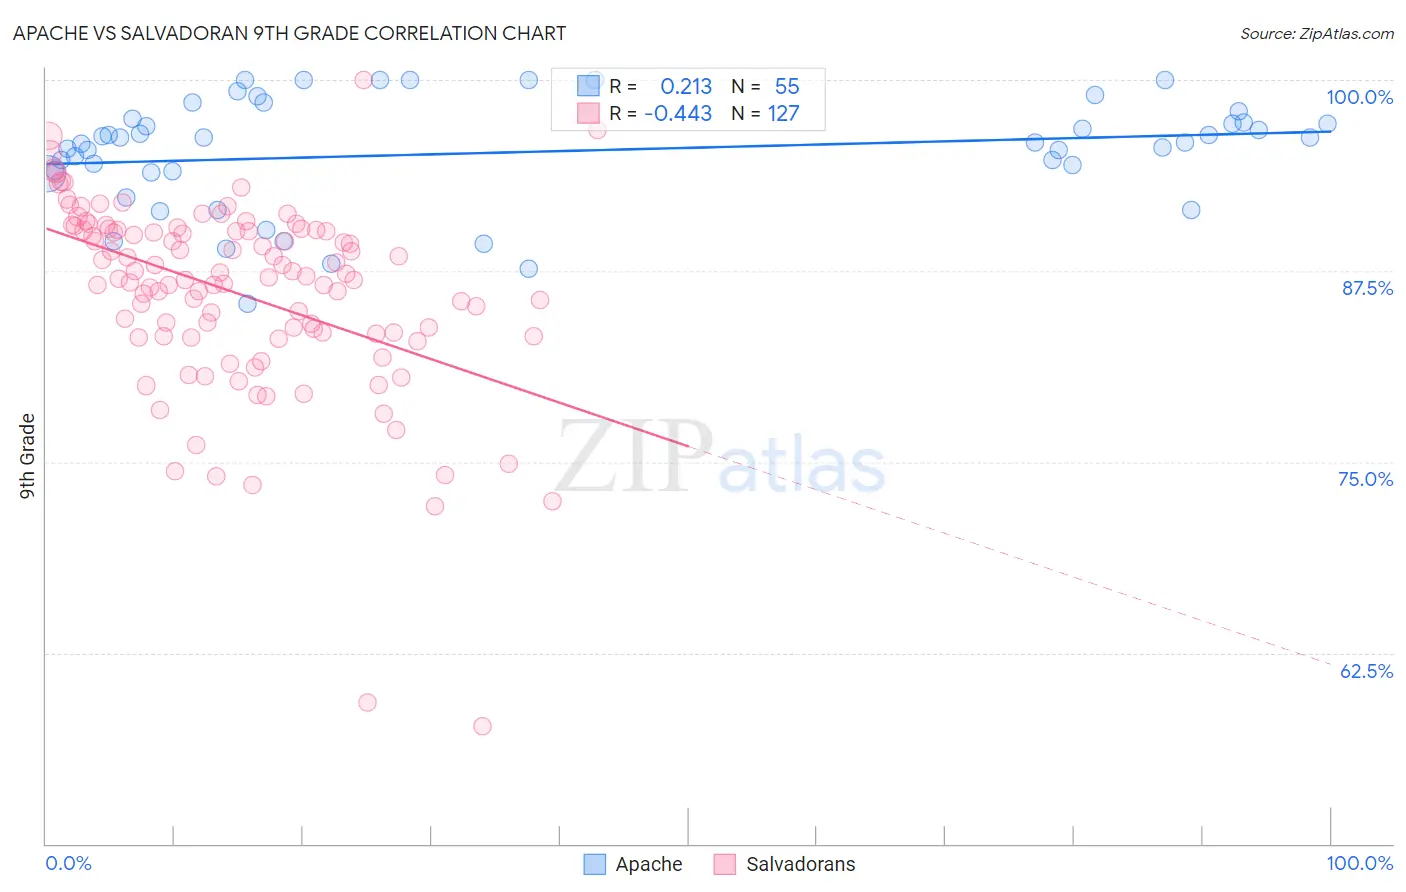
Apache vs Salvadoran 9th Grade Correlation Chart
The statistical analysis conducted on geographies consisting of 231,142,637 people shows a weak positive correlation between the proportion of Apache and percentage of population with at least 9th grade education in the United States with a correlation coefficient (R) of 0.213 and weighted average of 94.3%. Similarly, the statistical analysis conducted on geographies consisting of 399,034,410 people shows a moderate negative correlation between the proportion of Salvadorans and percentage of population with at least 9th grade education in the United States with a correlation coefficient (R) of -0.443 and weighted average of 89.6%, a difference of 5.3%.
9th Grade Correlation Summary
| Measurement | Apache | Salvadoran |
| Minimum | 85.4% | 57.7% |
| Maximum | 100.0% | 100.0% |
| Range | 14.6% | 42.3% |
| Mean | 95.3% | 86.0% |
| Median | 95.9% | 87.0% |
| Interquartile 25% (IQ1) | 93.9% | 83.2% |
| Interquartile 75% (IQ3) | 97.5% | 90.2% |
| Interquartile Range (IQR) | 3.6% | 7.0% |
| Standard Deviation (Sample) | 3.6% | 6.4% |
| Standard Deviation (Population) | 3.6% | 6.3% |
Similar Demographics by 9th Grade
Demographics Similar to Apache by 9th Grade
In terms of 9th grade, the demographic groups most similar to Apache are Immigrants from Panama (94.3%, a difference of 0.010%), Immigrants from Africa (94.3%, a difference of 0.010%), Lumbee (94.4%, a difference of 0.020%), Immigrants from Southern Europe (94.3%, a difference of 0.020%), and Nigerian (94.3%, a difference of 0.020%).
| Demographics | Rating | Rank | 9th Grade |
| Bahamians | 7.0 /100 | #223 | Tragic 94.4% |
| Tongans | 6.0 /100 | #224 | Tragic 94.4% |
| Ethiopians | 5.4 /100 | #225 | Tragic 94.4% |
| Sub-Saharan Africans | 5.4 /100 | #226 | Tragic 94.4% |
| Immigrants | Sierra Leone | 4.8 /100 | #227 | Tragic 94.4% |
| Lumbee | 4.7 /100 | #228 | Tragic 94.4% |
| Immigrants | Southern Europe | 4.5 /100 | #229 | Tragic 94.3% |
| Apache | 4.2 /100 | #230 | Tragic 94.3% |
| Immigrants | Panama | 4.0 /100 | #231 | Tragic 94.3% |
| Immigrants | Africa | 3.9 /100 | #232 | Tragic 94.3% |
| Nigerians | 3.7 /100 | #233 | Tragic 94.3% |
| Costa Ricans | 3.5 /100 | #234 | Tragic 94.3% |
| Bolivians | 3.3 /100 | #235 | Tragic 94.3% |
| Somalis | 2.9 /100 | #236 | Tragic 94.3% |
| Koreans | 2.9 /100 | #237 | Tragic 94.3% |
Demographics Similar to Salvadorans by 9th Grade
In terms of 9th grade, the demographic groups most similar to Salvadorans are Immigrants from Guatemala (89.4%, a difference of 0.20%), Guatemalan (89.9%, a difference of 0.31%), Mexican (90.0%, a difference of 0.43%), Yakama (90.1%, a difference of 0.49%), and Immigrants from El Salvador (89.0%, a difference of 0.71%).
| Demographics | Rating | Rank | 9th Grade |
| Immigrants | Yemen | 0.0 /100 | #333 | Tragic 90.8% |
| Immigrants | Azores | 0.0 /100 | #334 | Tragic 90.8% |
| Immigrants | Honduras | 0.0 /100 | #335 | Tragic 90.6% |
| Immigrants | Dominican Republic | 0.0 /100 | #336 | Tragic 90.5% |
| Immigrants | Latin America | 0.0 /100 | #337 | Tragic 90.4% |
| Central Americans | 0.0 /100 | #338 | Tragic 90.4% |
| Yakama | 0.0 /100 | #339 | Tragic 90.1% |
| Mexicans | 0.0 /100 | #340 | Tragic 90.0% |
| Guatemalans | 0.0 /100 | #341 | Tragic 89.9% |
| Salvadorans | 0.0 /100 | #342 | Tragic 89.6% |
| Immigrants | Guatemala | 0.0 /100 | #343 | Tragic 89.4% |
| Immigrants | El Salvador | 0.0 /100 | #344 | Tragic 89.0% |
| Immigrants | Central America | 0.0 /100 | #345 | Tragic 89.0% |
| Immigrants | Mexico | 0.0 /100 | #346 | Tragic 88.7% |
| Spanish American Indians | 0.0 /100 | #347 | Tragic 88.3% |