Houma vs Immigrants from Russia 4th Grade
COMPARE
Houma
Immigrants from Russia
4th Grade
4th Grade Comparison
Houma
Immigrants from Russia
96.8%
4TH GRADE
0.0/ 100
METRIC RATING
287th/ 347
METRIC RANK
97.6%
4TH GRADE
67.0/ 100
METRIC RATING
154th/ 347
METRIC RANK
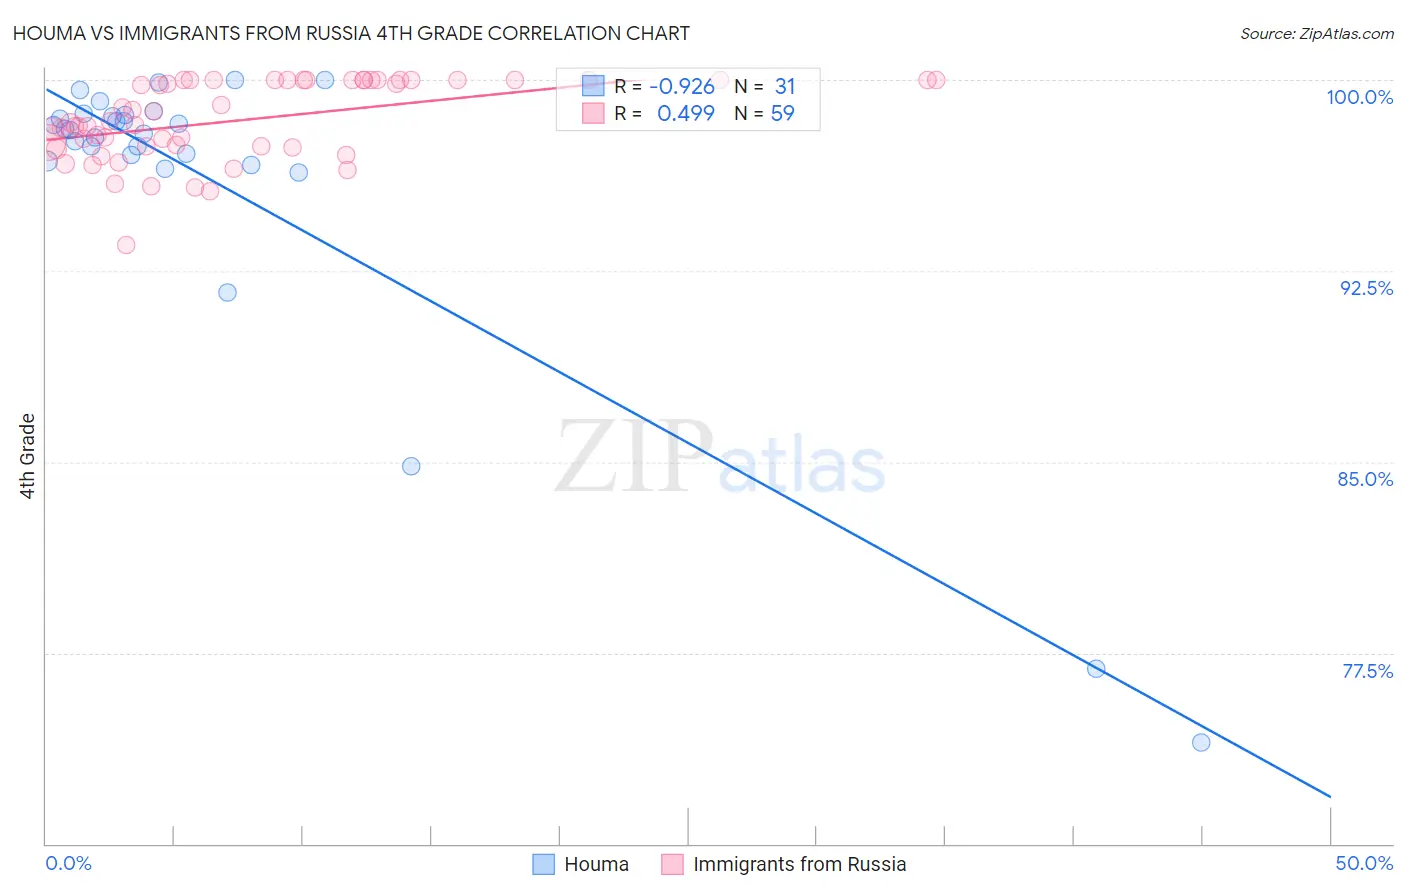
Houma vs Immigrants from Russia 4th Grade Correlation Chart
The statistical analysis conducted on geographies consisting of 36,795,916 people shows a near-perfect negative correlation between the proportion of Houma and percentage of population with at least 4th grade education in the United States with a correlation coefficient (R) of -0.926 and weighted average of 96.8%. Similarly, the statistical analysis conducted on geographies consisting of 347,948,494 people shows a moderate positive correlation between the proportion of Immigrants from Russia and percentage of population with at least 4th grade education in the United States with a correlation coefficient (R) of 0.499 and weighted average of 97.6%, a difference of 0.84%.
4th Grade Correlation Summary
| Measurement | Houma | Immigrants from Russia |
| Minimum | 74.0% | 93.5% |
| Maximum | 100.0% | 100.0% |
| Range | 26.0% | 6.5% |
| Mean | 96.0% | 98.4% |
| Median | 98.1% | 98.3% |
| Interquartile 25% (IQ1) | 96.8% | 97.4% |
| Interquartile 75% (IQ3) | 98.6% | 100.0% |
| Interquartile Range (IQR) | 1.8% | 2.6% |
| Standard Deviation (Sample) | 6.2% | 1.6% |
| Standard Deviation (Population) | 6.1% | 1.5% |
Similar Demographics by 4th Grade
Demographics Similar to Houma by 4th Grade
In terms of 4th grade, the demographic groups most similar to Houma are Immigrants from Afghanistan (96.8%, a difference of 0.0%), Immigrants from West Indies (96.7%, a difference of 0.020%), British West Indian (96.7%, a difference of 0.030%), Immigrants from Barbados (96.8%, a difference of 0.040%), and Immigrants from Thailand (96.8%, a difference of 0.040%).
| Demographics | Rating | Rank | 4th Grade |
| Barbadians | 0.1 /100 | #280 | Tragic 96.9% |
| Immigrants | Hong Kong | 0.1 /100 | #281 | Tragic 96.9% |
| Immigrants | Trinidad and Tobago | 0.1 /100 | #282 | Tragic 96.8% |
| Immigrants | Philippines | 0.1 /100 | #283 | Tragic 96.8% |
| Immigrants | St. Vincent and the Grenadines | 0.1 /100 | #284 | Tragic 96.8% |
| Immigrants | Barbados | 0.0 /100 | #285 | Tragic 96.8% |
| Immigrants | Thailand | 0.0 /100 | #286 | Tragic 96.8% |
| Houma | 0.0 /100 | #287 | Tragic 96.8% |
| Immigrants | Afghanistan | 0.0 /100 | #288 | Tragic 96.8% |
| Immigrants | West Indies | 0.0 /100 | #289 | Tragic 96.7% |
| British West Indians | 0.0 /100 | #290 | Tragic 96.7% |
| Immigrants | Grenada | 0.0 /100 | #291 | Tragic 96.7% |
| Malaysians | 0.0 /100 | #292 | Tragic 96.7% |
| Puerto Ricans | 0.0 /100 | #293 | Tragic 96.7% |
| Immigrants | Eritrea | 0.0 /100 | #294 | Tragic 96.7% |
Demographics Similar to Immigrants from Russia by 4th Grade
In terms of 4th grade, the demographic groups most similar to Immigrants from Russia are Albanian (97.6%, a difference of 0.0%), Immigrants from Jordan (97.6%, a difference of 0.0%), Immigrants from Bosnia and Herzegovina (97.6%, a difference of 0.0%), French American Indian (97.6%, a difference of 0.0%), and Immigrants from Italy (97.6%, a difference of 0.010%).
| Demographics | Rating | Rank | 4th Grade |
| Ute | 80.6 /100 | #147 | Excellent 97.7% |
| Hopi | 80.6 /100 | #148 | Excellent 97.7% |
| Soviet Union | 77.8 /100 | #149 | Good 97.6% |
| Immigrants | Israel | 77.7 /100 | #150 | Good 97.6% |
| Alsatians | 77.2 /100 | #151 | Good 97.6% |
| Immigrants | South Central Asia | 76.2 /100 | #152 | Good 97.6% |
| Immigrants | Eastern Europe | 71.3 /100 | #153 | Good 97.6% |
| Immigrants | Russia | 67.0 /100 | #154 | Good 97.6% |
| Albanians | 67.0 /100 | #155 | Good 97.6% |
| Immigrants | Jordan | 66.9 /100 | #156 | Good 97.6% |
| Immigrants | Bosnia and Herzegovina | 66.0 /100 | #157 | Good 97.6% |
| French American Indians | 65.9 /100 | #158 | Good 97.6% |
| Immigrants | Italy | 63.7 /100 | #159 | Good 97.6% |
| Apache | 61.3 /100 | #160 | Good 97.6% |
| Marshallese | 60.8 /100 | #161 | Good 97.6% |