Houma vs Honduran Female Disability
COMPARE
Houma
Honduran
Female Disability
Female Disability Comparison
Houma
Hondurans
16.9%
FEMALE DISABILITY
0.0/ 100
METRIC RATING
347th/ 347
METRIC RANK
12.3%
FEMALE DISABILITY
25.4/ 100
METRIC RATING
197th/ 347
METRIC RANK
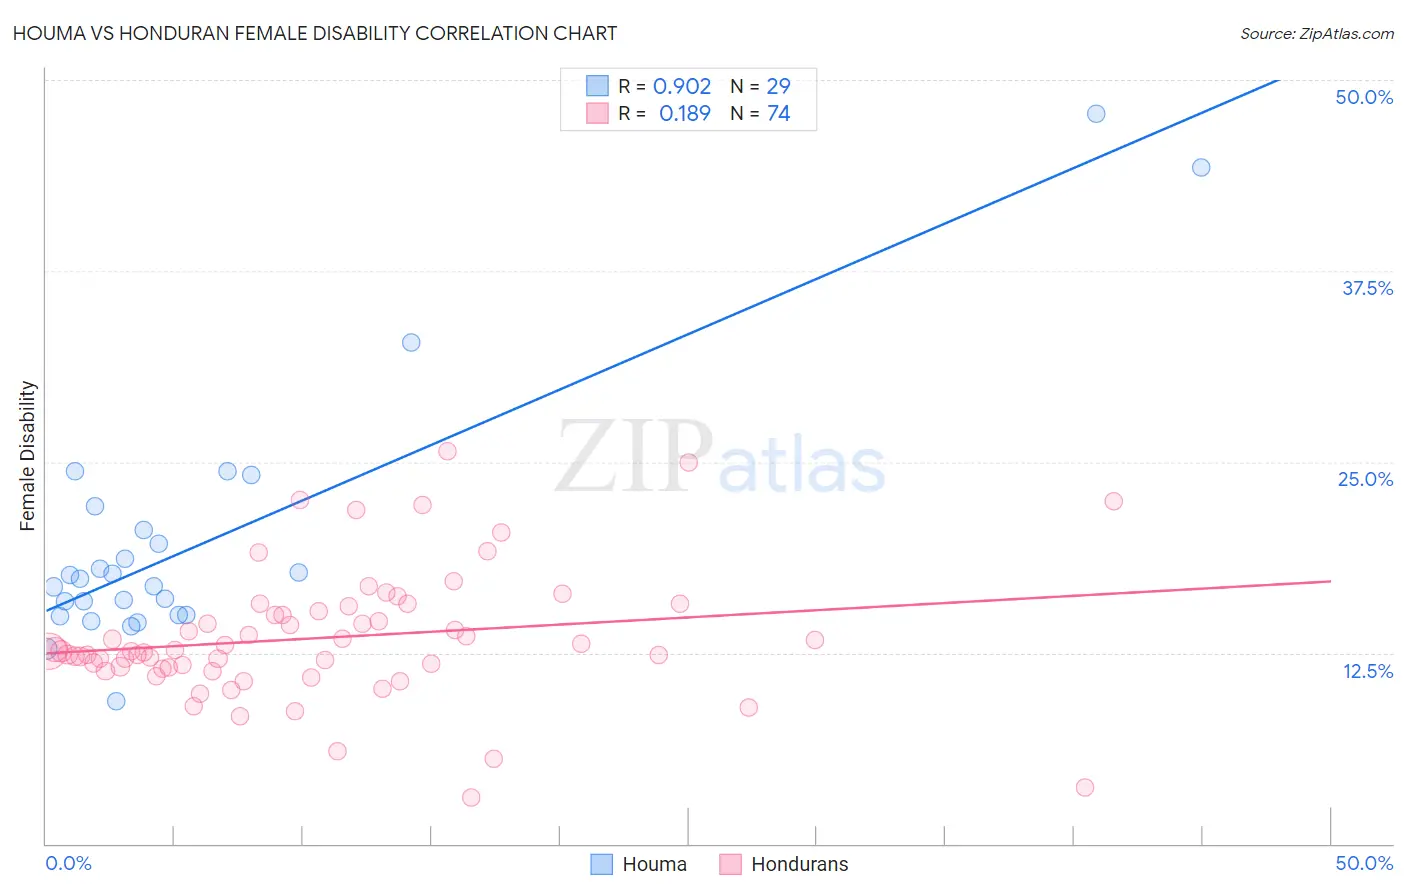
Houma vs Honduran Female Disability Correlation Chart
The statistical analysis conducted on geographies consisting of 36,798,615 people shows a near-perfect positive correlation between the proportion of Houma and percentage of females with a disability in the United States with a correlation coefficient (R) of 0.902 and weighted average of 16.9%. Similarly, the statistical analysis conducted on geographies consisting of 357,759,826 people shows a poor positive correlation between the proportion of Hondurans and percentage of females with a disability in the United States with a correlation coefficient (R) of 0.189 and weighted average of 12.3%, a difference of 37.2%.
Female Disability Correlation Summary
| Measurement | Houma | Honduran |
| Minimum | 9.3% | 3.1% |
| Maximum | 47.8% | 25.7% |
| Range | 38.4% | 22.6% |
| Mean | 19.8% | 13.5% |
| Median | 17.3% | 12.6% |
| Interquartile 25% (IQ1) | 14.9% | 11.6% |
| Interquartile 75% (IQ3) | 21.3% | 15.2% |
| Interquartile Range (IQR) | 6.4% | 3.6% |
| Standard Deviation (Sample) | 8.5% | 4.2% |
| Standard Deviation (Population) | 8.4% | 4.2% |
Similar Demographics by Female Disability
Demographics Similar to Houma by Female Disability
In terms of female disability, the demographic groups most similar to Houma are Tsimshian (16.8%, a difference of 0.77%), Puerto Rican (16.6%, a difference of 1.7%), Kiowa (15.8%, a difference of 7.0%), Lumbee (15.8%, a difference of 7.1%), and Creek (15.7%, a difference of 7.9%).
| Demographics | Rating | Rank | Female Disability |
| Immigrants | Azores | 0.0 /100 | #333 | Tragic 14.9% |
| Cherokee | 0.0 /100 | #334 | Tragic 14.9% |
| Cajuns | 0.0 /100 | #335 | Tragic 14.9% |
| Seminole | 0.0 /100 | #336 | Tragic 15.0% |
| Tohono O'odham | 0.0 /100 | #337 | Tragic 15.0% |
| Dutch West Indians | 0.0 /100 | #338 | Tragic 15.0% |
| Colville | 0.0 /100 | #339 | Tragic 15.1% |
| Chickasaw | 0.0 /100 | #340 | Tragic 15.2% |
| Choctaw | 0.0 /100 | #341 | Tragic 15.4% |
| Creek | 0.0 /100 | #342 | Tragic 15.7% |
| Lumbee | 0.0 /100 | #343 | Tragic 15.8% |
| Kiowa | 0.0 /100 | #344 | Tragic 15.8% |
| Puerto Ricans | 0.0 /100 | #345 | Tragic 16.6% |
| Tsimshian | 0.0 /100 | #346 | Tragic 16.8% |
| Houma | 0.0 /100 | #347 | Tragic 16.9% |
Demographics Similar to Hondurans by Female Disability
In terms of female disability, the demographic groups most similar to Hondurans are Immigrants from Panama (12.3%, a difference of 0.0%), Mexican American Indian (12.3%, a difference of 0.030%), Immigrants from Trinidad and Tobago (12.3%, a difference of 0.040%), Swedish (12.3%, a difference of 0.060%), and Ukrainian (12.3%, a difference of 0.080%).
| Demographics | Rating | Rank | Female Disability |
| Immigrants | Honduras | 31.3 /100 | #190 | Fair 12.3% |
| Armenians | 29.7 /100 | #191 | Fair 12.3% |
| Immigrants | Western Africa | 29.2 /100 | #192 | Fair 12.3% |
| Northern Europeans | 27.5 /100 | #193 | Fair 12.3% |
| Ukrainians | 27.2 /100 | #194 | Fair 12.3% |
| Swedes | 26.6 /100 | #195 | Fair 12.3% |
| Immigrants | Panama | 25.5 /100 | #196 | Fair 12.3% |
| Hondurans | 25.4 /100 | #197 | Fair 12.3% |
| Mexican American Indians | 24.9 /100 | #198 | Fair 12.3% |
| Immigrants | Trinidad and Tobago | 24.7 /100 | #199 | Fair 12.3% |
| Trinidadians and Tobagonians | 22.4 /100 | #200 | Fair 12.3% |
| Chinese | 22.1 /100 | #201 | Fair 12.3% |
| Somalis | 21.5 /100 | #202 | Fair 12.3% |
| Immigrants | Barbados | 21.1 /100 | #203 | Fair 12.3% |
| Immigrants | Zaire | 20.9 /100 | #204 | Fair 12.3% |