Honduran vs Puerto Rican No Schooling Completed
COMPARE
Honduran
Puerto Rican
No Schooling Completed
No Schooling Completed Comparison
Hondurans
Puerto Ricans
3.1%
NO SCHOOLING COMPLETED
0.0/ 100
METRIC RATING
313th/ 347
METRIC RANK
2.3%
NO SCHOOLING COMPLETED
3.4/ 100
METRIC RATING
230th/ 347
METRIC RANK
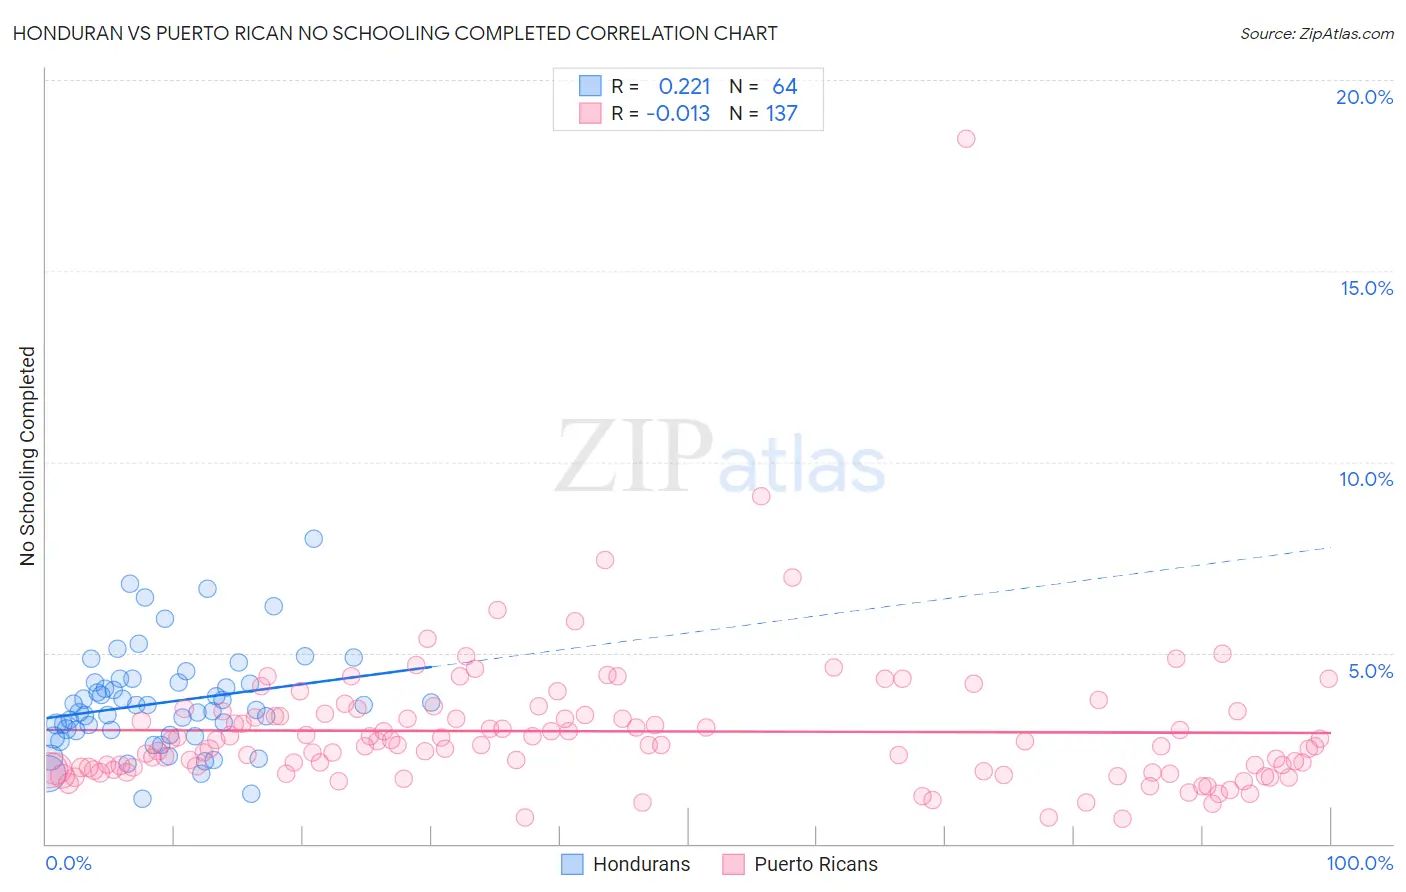
Honduran vs Puerto Rican No Schooling Completed Correlation Chart
The statistical analysis conducted on geographies consisting of 355,822,203 people shows a weak positive correlation between the proportion of Hondurans and percentage of population with no schooling in the United States with a correlation coefficient (R) of 0.221 and weighted average of 3.1%. Similarly, the statistical analysis conducted on geographies consisting of 518,442,675 people shows no correlation between the proportion of Puerto Ricans and percentage of population with no schooling in the United States with a correlation coefficient (R) of -0.013 and weighted average of 2.3%, a difference of 31.8%.
No Schooling Completed Correlation Summary
| Measurement | Honduran | Puerto Rican |
| Minimum | 1.2% | 0.67% |
| Maximum | 8.0% | 18.5% |
| Range | 6.8% | 17.8% |
| Mean | 3.7% | 2.9% |
| Median | 3.6% | 2.6% |
| Interquartile 25% (IQ1) | 2.9% | 1.9% |
| Interquartile 75% (IQ3) | 4.2% | 3.4% |
| Interquartile Range (IQR) | 1.3% | 1.5% |
| Standard Deviation (Sample) | 1.3% | 1.9% |
| Standard Deviation (Population) | 1.3% | 1.9% |
Similar Demographics by No Schooling Completed
Demographics Similar to Hondurans by No Schooling Completed
In terms of no schooling completed, the demographic groups most similar to Hondurans are Immigrants from Belize (3.1%, a difference of 0.090%), Immigrants from Nicaragua (3.1%, a difference of 0.33%), Sri Lankan (3.0%, a difference of 0.51%), Immigrants from Ecuador (3.1%, a difference of 0.69%), and Immigrants from the Azores (3.0%, a difference of 0.79%).
| Demographics | Rating | Rank | No Schooling Completed |
| Belizeans | 0.0 /100 | #306 | Tragic 3.0% |
| Immigrants | Haiti | 0.0 /100 | #307 | Tragic 3.0% |
| Immigrants | Somalia | 0.0 /100 | #308 | Tragic 3.0% |
| Hispanics or Latinos | 0.0 /100 | #309 | Tragic 3.0% |
| Guyanese | 0.0 /100 | #310 | Tragic 3.0% |
| Immigrants | Azores | 0.0 /100 | #311 | Tragic 3.0% |
| Sri Lankans | 0.0 /100 | #312 | Tragic 3.0% |
| Hondurans | 0.0 /100 | #313 | Tragic 3.1% |
| Immigrants | Belize | 0.0 /100 | #314 | Tragic 3.1% |
| Immigrants | Nicaragua | 0.0 /100 | #315 | Tragic 3.1% |
| Immigrants | Ecuador | 0.0 /100 | #316 | Tragic 3.1% |
| Cape Verdeans | 0.0 /100 | #317 | Tragic 3.1% |
| Immigrants | Guyana | 0.0 /100 | #318 | Tragic 3.1% |
| Immigrants | Burma/Myanmar | 0.0 /100 | #319 | Tragic 3.1% |
| Immigrants | Bangladesh | 0.0 /100 | #320 | Tragic 3.1% |
Demographics Similar to Puerto Ricans by No Schooling Completed
In terms of no schooling completed, the demographic groups most similar to Puerto Ricans are Immigrants from Uruguay (2.3%, a difference of 0.020%), Immigrants from Pakistan (2.3%, a difference of 0.13%), U.S. Virgin Islander (2.3%, a difference of 0.22%), Colombian (2.3%, a difference of 0.25%), and Immigrants from Uganda (2.3%, a difference of 0.51%).
| Demographics | Rating | Rank | No Schooling Completed |
| Immigrants | Lebanon | 4.5 /100 | #223 | Tragic 2.3% |
| Tohono O'odham | 4.1 /100 | #224 | Tragic 2.3% |
| Sudanese | 4.1 /100 | #225 | Tragic 2.3% |
| Sierra Leoneans | 4.1 /100 | #226 | Tragic 2.3% |
| Immigrants | Uganda | 4.0 /100 | #227 | Tragic 2.3% |
| U.S. Virgin Islanders | 3.7 /100 | #228 | Tragic 2.3% |
| Immigrants | Pakistan | 3.6 /100 | #229 | Tragic 2.3% |
| Puerto Ricans | 3.4 /100 | #230 | Tragic 2.3% |
| Immigrants | Uruguay | 3.4 /100 | #231 | Tragic 2.3% |
| Colombians | 3.2 /100 | #232 | Tragic 2.3% |
| Immigrants | Malaysia | 2.8 /100 | #233 | Tragic 2.3% |
| Nigerians | 2.6 /100 | #234 | Tragic 2.3% |
| Immigrants | Western Asia | 2.6 /100 | #235 | Tragic 2.3% |
| Iraqis | 2.2 /100 | #236 | Tragic 2.4% |
| Immigrants | Eastern Asia | 2.0 /100 | #237 | Tragic 2.4% |