Immigrants from South America vs Spaniard 7th Grade
COMPARE
Immigrants from South America
Spaniard
7th Grade
7th Grade Comparison
Immigrants from South America
Spaniards
95.1%
7TH GRADE
0.2/ 100
METRIC RATING
271st/ 347
METRIC RANK
96.1%
7TH GRADE
62.6/ 100
METRIC RATING
163rd/ 347
METRIC RANK
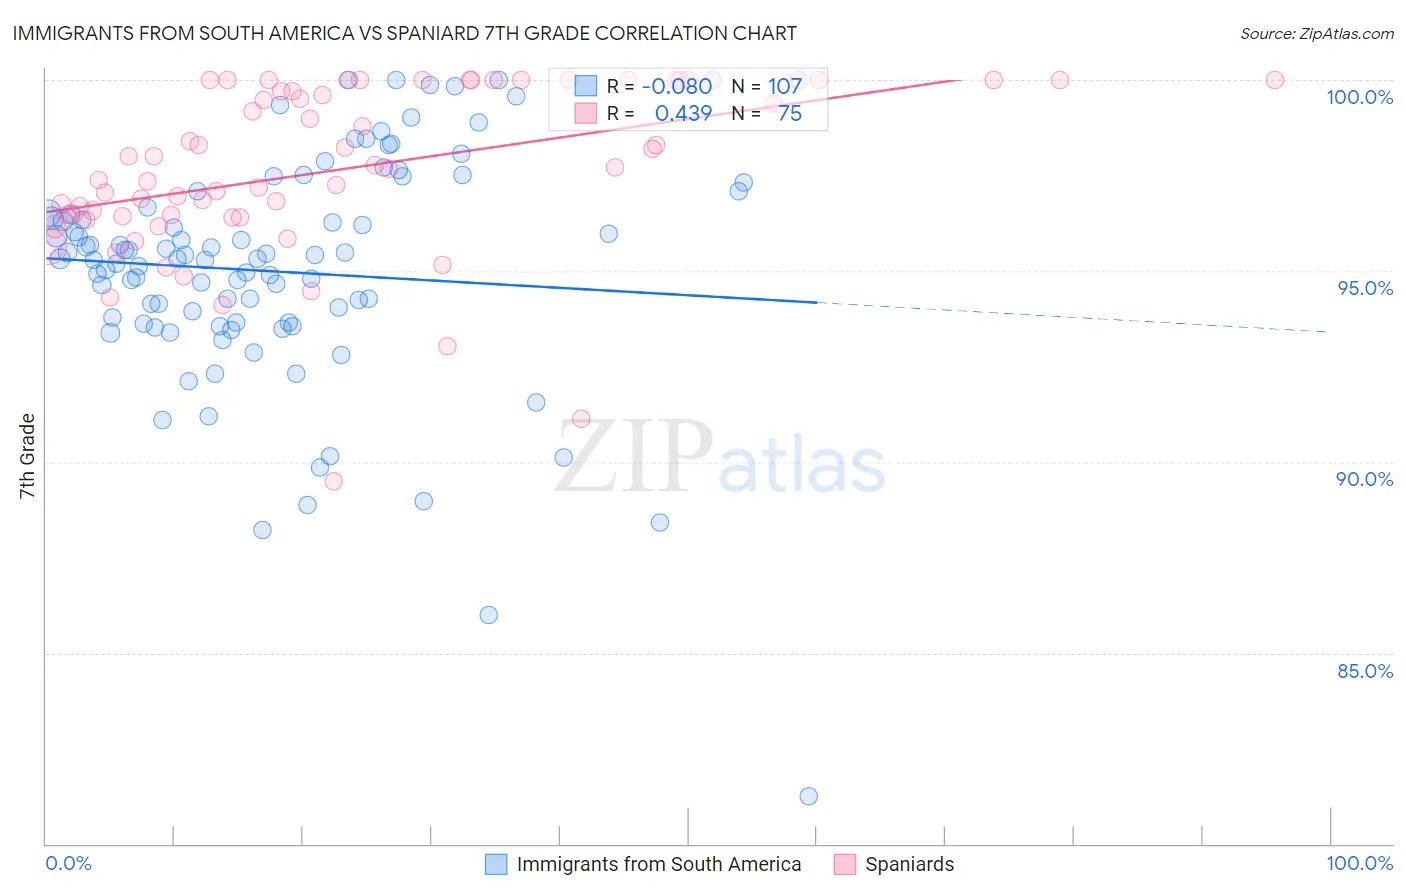
Immigrants from South America vs Spaniard 7th Grade Correlation Chart
The statistical analysis conducted on geographies consisting of 486,312,594 people shows a slight negative correlation between the proportion of Immigrants from South America and percentage of population with at least 7th grade education in the United States with a correlation coefficient (R) of -0.080 and weighted average of 95.1%. Similarly, the statistical analysis conducted on geographies consisting of 443,544,503 people shows a moderate positive correlation between the proportion of Spaniards and percentage of population with at least 7th grade education in the United States with a correlation coefficient (R) of 0.439 and weighted average of 96.1%, a difference of 1.0%.
7th Grade Correlation Summary
| Measurement | Immigrants from South America | Spaniard |
| Minimum | 81.2% | 89.5% |
| Maximum | 100.0% | 100.0% |
| Range | 18.8% | 10.5% |
| Mean | 95.0% | 97.7% |
| Median | 95.3% | 97.8% |
| Interquartile 25% (IQ1) | 93.6% | 96.4% |
| Interquartile 75% (IQ3) | 96.5% | 100.0% |
| Interquartile Range (IQR) | 2.9% | 3.6% |
| Standard Deviation (Sample) | 3.0% | 2.2% |
| Standard Deviation (Population) | 3.0% | 2.2% |
Similar Demographics by 7th Grade
Demographics Similar to Immigrants from South America by 7th Grade
In terms of 7th grade, the demographic groups most similar to Immigrants from South America are Houma (95.1%, a difference of 0.0%), Peruvian (95.1%, a difference of 0.0%), Immigrants from Uzbekistan (95.1%, a difference of 0.0%), Immigrants from Western Africa (95.1%, a difference of 0.010%), and Trinidadian and Tobagonian (95.2%, a difference of 0.020%).
| Demographics | Rating | Rank | 7th Grade |
| Immigrants | Nigeria | 0.4 /100 | #264 | Tragic 95.2% |
| Immigrants | Uruguay | 0.3 /100 | #265 | Tragic 95.2% |
| Immigrants | Ghana | 0.3 /100 | #266 | Tragic 95.2% |
| Yuman | 0.3 /100 | #267 | Tragic 95.2% |
| Immigrants | Hong Kong | 0.3 /100 | #268 | Tragic 95.2% |
| Trinidadians and Tobagonians | 0.3 /100 | #269 | Tragic 95.2% |
| Houma | 0.2 /100 | #270 | Tragic 95.1% |
| Immigrants | South America | 0.2 /100 | #271 | Tragic 95.1% |
| Peruvians | 0.2 /100 | #272 | Tragic 95.1% |
| Immigrants | Uzbekistan | 0.2 /100 | #273 | Tragic 95.1% |
| Immigrants | Western Africa | 0.2 /100 | #274 | Tragic 95.1% |
| Immigrants | Colombia | 0.2 /100 | #275 | Tragic 95.1% |
| Immigrants | Thailand | 0.2 /100 | #276 | Tragic 95.1% |
| Immigrants | Afghanistan | 0.2 /100 | #277 | Tragic 95.1% |
| Immigrants | Trinidad and Tobago | 0.1 /100 | #278 | Tragic 95.1% |
Demographics Similar to Spaniards by 7th Grade
In terms of 7th grade, the demographic groups most similar to Spaniards are Immigrants from Italy (96.1%, a difference of 0.0%), Pima (96.1%, a difference of 0.010%), Immigrants from Taiwan (96.1%, a difference of 0.010%), Immigrants from Kazakhstan (96.1%, a difference of 0.010%), and Bermudan (96.1%, a difference of 0.020%).
| Demographics | Rating | Rank | 7th Grade |
| Kenyans | 76.2 /100 | #156 | Good 96.2% |
| Ugandans | 75.5 /100 | #157 | Good 96.2% |
| Arabs | 68.6 /100 | #158 | Good 96.2% |
| Alsatians | 67.2 /100 | #159 | Good 96.1% |
| Immigrants | Kenya | 66.8 /100 | #160 | Good 96.1% |
| Bermudans | 66.3 /100 | #161 | Good 96.1% |
| Pima | 64.3 /100 | #162 | Good 96.1% |
| Spaniards | 62.6 /100 | #163 | Good 96.1% |
| Immigrants | Italy | 62.1 /100 | #164 | Good 96.1% |
| Immigrants | Taiwan | 61.5 /100 | #165 | Good 96.1% |
| Immigrants | Kazakhstan | 61.0 /100 | #166 | Good 96.1% |
| Immigrants | Sri Lanka | 59.9 /100 | #167 | Average 96.1% |
| Immigrants | Poland | 59.0 /100 | #168 | Average 96.1% |
| Ute | 55.8 /100 | #169 | Average 96.1% |
| Immigrants | Ukraine | 55.0 /100 | #170 | Average 96.1% |