Immigrants from Eastern Asia vs Spaniard 7th Grade
COMPARE
Immigrants from Eastern Asia
Spaniard
7th Grade
7th Grade Comparison
Immigrants from Eastern Asia
Spaniards
95.6%
7TH GRADE
5.8/ 100
METRIC RATING
226th/ 347
METRIC RANK
96.1%
7TH GRADE
62.6/ 100
METRIC RATING
163rd/ 347
METRIC RANK
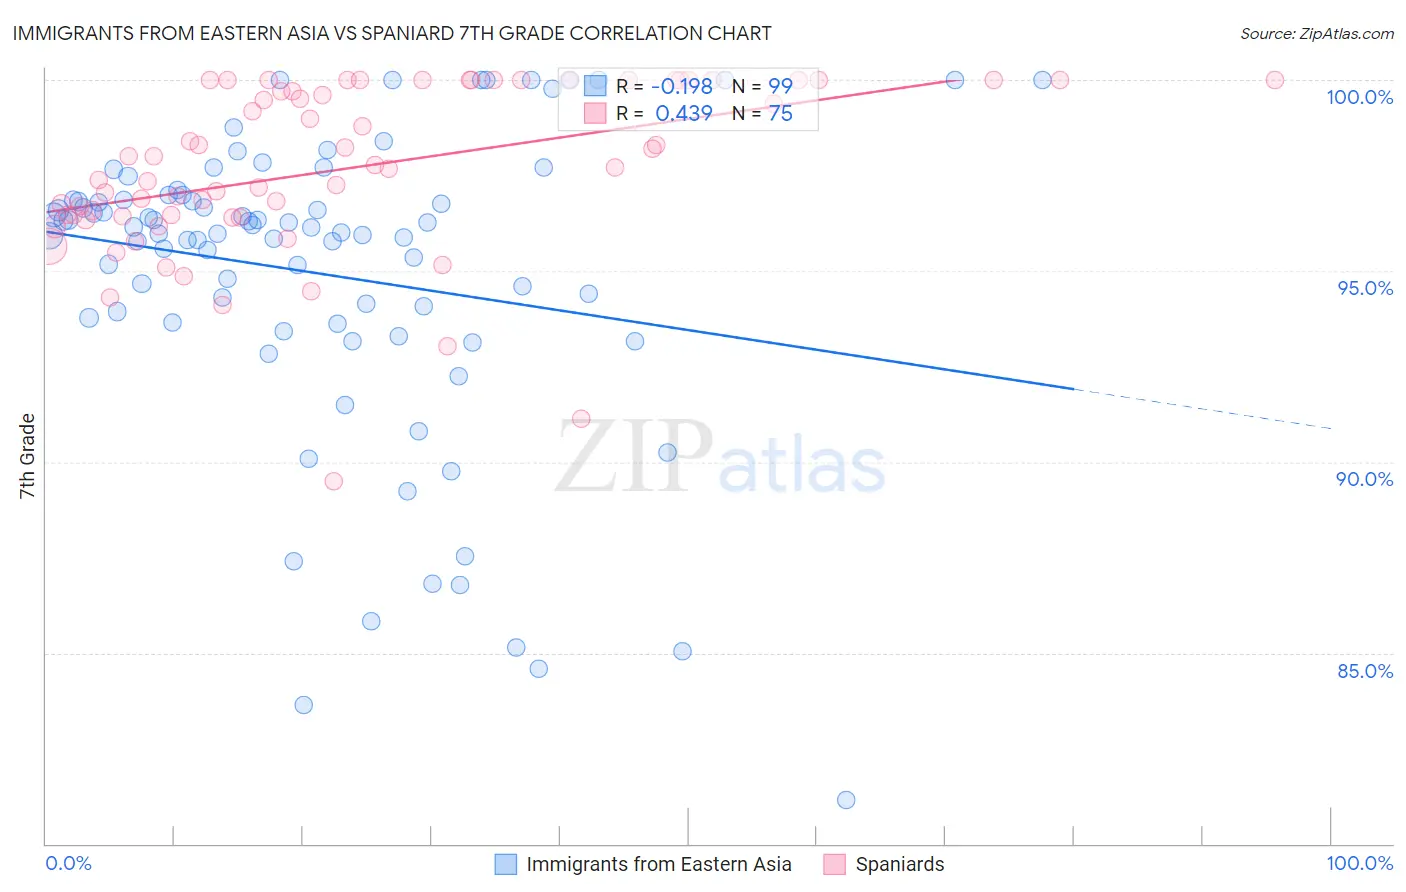
Immigrants from Eastern Asia vs Spaniard 7th Grade Correlation Chart
The statistical analysis conducted on geographies consisting of 499,846,352 people shows a poor negative correlation between the proportion of Immigrants from Eastern Asia and percentage of population with at least 7th grade education in the United States with a correlation coefficient (R) of -0.198 and weighted average of 95.6%. Similarly, the statistical analysis conducted on geographies consisting of 443,544,503 people shows a moderate positive correlation between the proportion of Spaniards and percentage of population with at least 7th grade education in the United States with a correlation coefficient (R) of 0.439 and weighted average of 96.1%, a difference of 0.51%.
7th Grade Correlation Summary
| Measurement | Immigrants from Eastern Asia | Spaniard |
| Minimum | 81.1% | 89.5% |
| Maximum | 100.0% | 100.0% |
| Range | 18.9% | 10.5% |
| Mean | 94.9% | 97.7% |
| Median | 96.0% | 97.8% |
| Interquartile 25% (IQ1) | 93.7% | 96.4% |
| Interquartile 75% (IQ3) | 96.9% | 100.0% |
| Interquartile Range (IQR) | 3.2% | 3.6% |
| Standard Deviation (Sample) | 4.0% | 2.2% |
| Standard Deviation (Population) | 4.0% | 2.2% |
Similar Demographics by 7th Grade
Demographics Similar to Immigrants from Eastern Asia by 7th Grade
In terms of 7th grade, the demographic groups most similar to Immigrants from Eastern Asia are Immigrants from Malaysia (95.6%, a difference of 0.010%), Immigrants from Western Asia (95.6%, a difference of 0.010%), Immigrants from Syria (95.7%, a difference of 0.020%), Immigrants from Oceania (95.7%, a difference of 0.020%), and Immigrants from Eastern Africa (95.6%, a difference of 0.020%).
| Demographics | Rating | Rank | 7th Grade |
| Immigrants | Southern Europe | 7.9 /100 | #219 | Tragic 95.7% |
| Sub-Saharan Africans | 7.2 /100 | #220 | Tragic 95.7% |
| Samoans | 7.0 /100 | #221 | Tragic 95.7% |
| Laotians | 6.8 /100 | #222 | Tragic 95.7% |
| Immigrants | Syria | 6.7 /100 | #223 | Tragic 95.7% |
| Immigrants | Oceania | 6.7 /100 | #224 | Tragic 95.7% |
| Immigrants | Malaysia | 6.2 /100 | #225 | Tragic 95.6% |
| Immigrants | Eastern Asia | 5.8 /100 | #226 | Tragic 95.6% |
| Immigrants | Western Asia | 5.4 /100 | #227 | Tragic 95.6% |
| Immigrants | Eastern Africa | 5.1 /100 | #228 | Tragic 95.6% |
| Immigrants | Panama | 4.9 /100 | #229 | Tragic 95.6% |
| Natives/Alaskans | 4.2 /100 | #230 | Tragic 95.6% |
| Senegalese | 4.0 /100 | #231 | Tragic 95.6% |
| Costa Ricans | 3.3 /100 | #232 | Tragic 95.5% |
| Immigrants | Indonesia | 3.3 /100 | #233 | Tragic 95.5% |
Demographics Similar to Spaniards by 7th Grade
In terms of 7th grade, the demographic groups most similar to Spaniards are Immigrants from Italy (96.1%, a difference of 0.0%), Pima (96.1%, a difference of 0.010%), Immigrants from Taiwan (96.1%, a difference of 0.010%), Immigrants from Kazakhstan (96.1%, a difference of 0.010%), and Bermudan (96.1%, a difference of 0.020%).
| Demographics | Rating | Rank | 7th Grade |
| Kenyans | 76.2 /100 | #156 | Good 96.2% |
| Ugandans | 75.5 /100 | #157 | Good 96.2% |
| Arabs | 68.6 /100 | #158 | Good 96.2% |
| Alsatians | 67.2 /100 | #159 | Good 96.1% |
| Immigrants | Kenya | 66.8 /100 | #160 | Good 96.1% |
| Bermudans | 66.3 /100 | #161 | Good 96.1% |
| Pima | 64.3 /100 | #162 | Good 96.1% |
| Spaniards | 62.6 /100 | #163 | Good 96.1% |
| Immigrants | Italy | 62.1 /100 | #164 | Good 96.1% |
| Immigrants | Taiwan | 61.5 /100 | #165 | Good 96.1% |
| Immigrants | Kazakhstan | 61.0 /100 | #166 | Good 96.1% |
| Immigrants | Sri Lanka | 59.9 /100 | #167 | Average 96.1% |
| Immigrants | Poland | 59.0 /100 | #168 | Average 96.1% |
| Ute | 55.8 /100 | #169 | Average 96.1% |
| Immigrants | Ukraine | 55.0 /100 | #170 | Average 96.1% |