Immigrants from Serbia vs Estonian College, 1 year or more
COMPARE
Immigrants from Serbia
Estonian
College, 1 year or more
College, 1 year or more Comparison
Immigrants from Serbia
Estonians
63.8%
COLLEGE, 1 YEAR OR MORE
99.6/ 100
METRIC RATING
59th/ 347
METRIC RANK
65.0%
COLLEGE, 1 YEAR OR MORE
99.9/ 100
METRIC RATING
39th/ 347
METRIC RANK
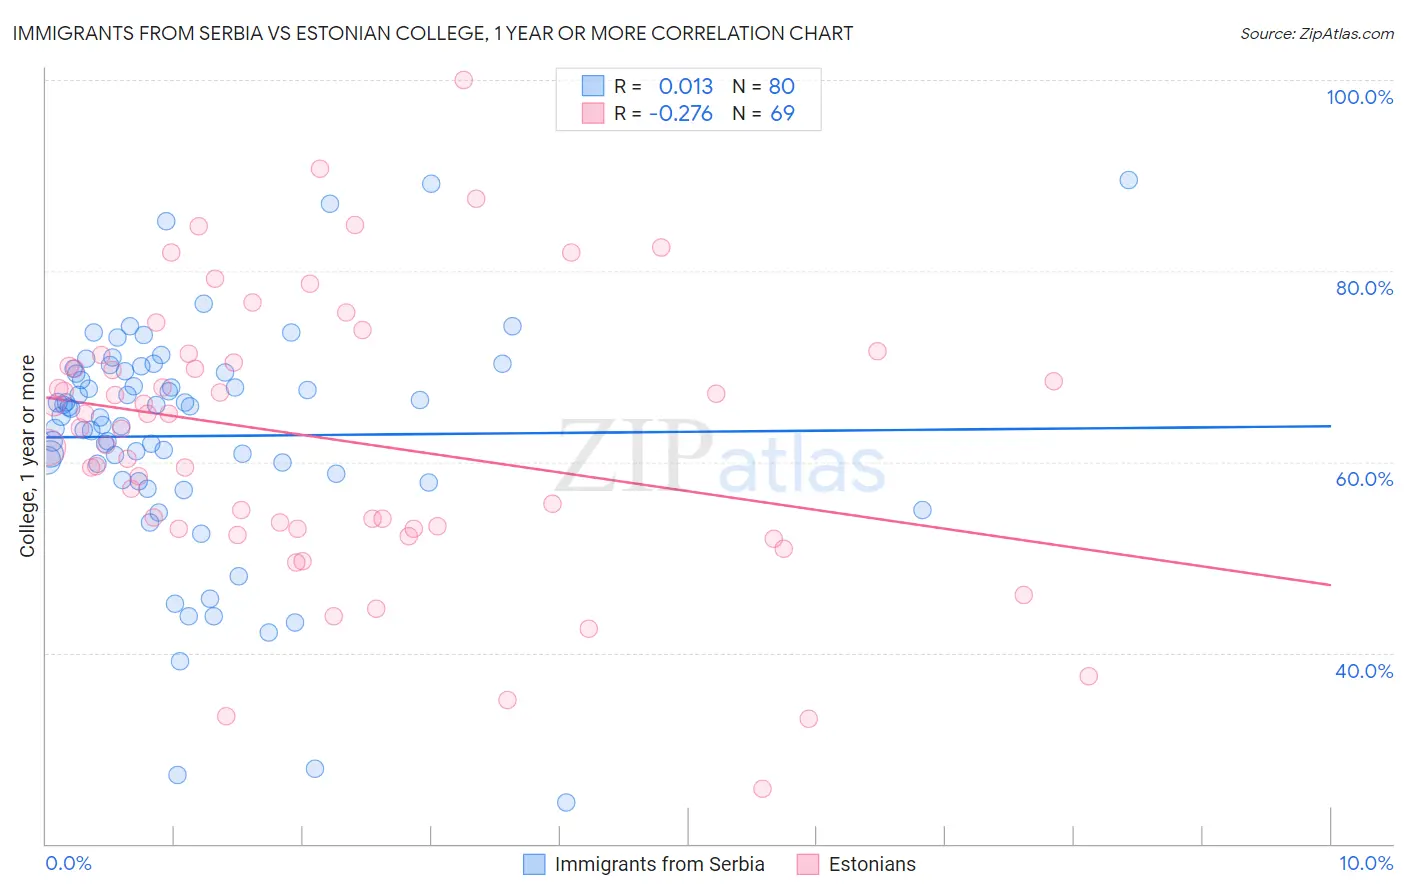
Immigrants from Serbia vs Estonian College, 1 year or more Correlation Chart
The statistical analysis conducted on geographies consisting of 131,742,963 people shows no correlation between the proportion of Immigrants from Serbia and percentage of population with at least college, 1 year or more education in the United States with a correlation coefficient (R) of 0.013 and weighted average of 63.8%. Similarly, the statistical analysis conducted on geographies consisting of 123,528,478 people shows a weak negative correlation between the proportion of Estonians and percentage of population with at least college, 1 year or more education in the United States with a correlation coefficient (R) of -0.276 and weighted average of 65.0%, a difference of 1.9%.
College, 1 year or more Correlation Summary
| Measurement | Immigrants from Serbia | Estonian |
| Minimum | 24.3% | 25.8% |
| Maximum | 89.5% | 100.0% |
| Range | 65.1% | 74.2% |
| Mean | 62.7% | 62.4% |
| Median | 65.2% | 63.5% |
| Interquartile 25% (IQ1) | 58.5% | 53.0% |
| Interquartile 75% (IQ3) | 69.4% | 70.8% |
| Interquartile Range (IQR) | 11.0% | 17.8% |
| Standard Deviation (Sample) | 12.2% | 14.5% |
| Standard Deviation (Population) | 12.1% | 14.4% |
Demographics Similar to Immigrants from Serbia and Estonians by College, 1 year or more
In terms of college, 1 year or more, the demographic groups most similar to Immigrants from Serbia are Immigrants from Asia (64.0%, a difference of 0.35%), South African (64.1%, a difference of 0.49%), Immigrants from Czechoslovakia (64.1%, a difference of 0.50%), Immigrants from Belarus (64.1%, a difference of 0.53%), and Zimbabwean (64.2%, a difference of 0.65%). Similarly, the demographic groups most similar to Estonians are Immigrants from Kuwait (65.0%, a difference of 0.060%), Mongolian (64.8%, a difference of 0.26%), Immigrants from Latvia (64.8%, a difference of 0.27%), Immigrants from Russia (64.7%, a difference of 0.39%), and Immigrants from Norway (64.7%, a difference of 0.41%).
| Demographics | Rating | Rank | College, 1 year or more |
| Estonians | 99.9 /100 | #39 | Exceptional 65.0% |
| Immigrants | Kuwait | 99.9 /100 | #40 | Exceptional 65.0% |
| Mongolians | 99.9 /100 | #41 | Exceptional 64.8% |
| Immigrants | Latvia | 99.9 /100 | #42 | Exceptional 64.8% |
| Immigrants | Russia | 99.9 /100 | #43 | Exceptional 64.7% |
| Immigrants | Norway | 99.9 /100 | #44 | Exceptional 64.7% |
| Immigrants | Lithuania | 99.9 /100 | #45 | Exceptional 64.6% |
| Bhutanese | 99.9 /100 | #46 | Exceptional 64.6% |
| Australians | 99.9 /100 | #47 | Exceptional 64.6% |
| Immigrants | Bulgaria | 99.9 /100 | #48 | Exceptional 64.6% |
| New Zealanders | 99.9 /100 | #49 | Exceptional 64.6% |
| Immigrants | Austria | 99.8 /100 | #50 | Exceptional 64.4% |
| Immigrants | Malaysia | 99.8 /100 | #51 | Exceptional 64.3% |
| Immigrants | Netherlands | 99.8 /100 | #52 | Exceptional 64.2% |
| Asians | 99.8 /100 | #53 | Exceptional 64.2% |
| Zimbabweans | 99.8 /100 | #54 | Exceptional 64.2% |
| Immigrants | Belarus | 99.7 /100 | #55 | Exceptional 64.1% |
| Immigrants | Czechoslovakia | 99.7 /100 | #56 | Exceptional 64.1% |
| South Africans | 99.7 /100 | #57 | Exceptional 64.1% |
| Immigrants | Asia | 99.7 /100 | #58 | Exceptional 64.0% |
| Immigrants | Serbia | 99.6 /100 | #59 | Exceptional 63.8% |