Honduran vs Estonian 6th Grade
COMPARE
Honduran
Estonian
6th Grade
6th Grade Comparison
Hondurans
Estonians
95.0%
6TH GRADE
0.0/ 100
METRIC RATING
328th/ 347
METRIC RANK
97.8%
6TH GRADE
99.8/ 100
METRIC RATING
49th/ 347
METRIC RANK
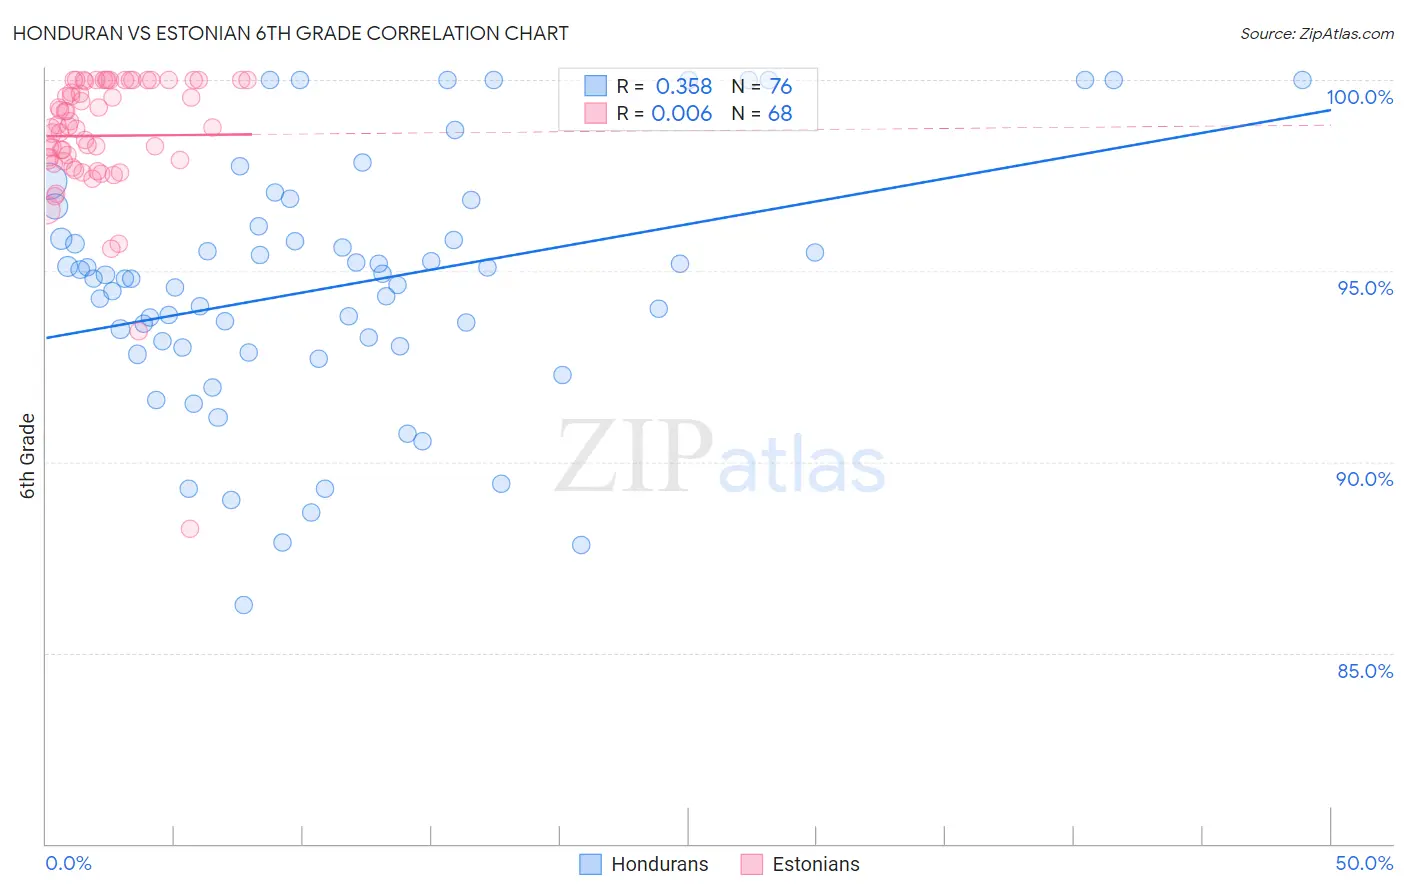
Honduran vs Estonian 6th Grade Correlation Chart
The statistical analysis conducted on geographies consisting of 357,784,803 people shows a mild positive correlation between the proportion of Hondurans and percentage of population with at least 6th grade education in the United States with a correlation coefficient (R) of 0.358 and weighted average of 95.0%. Similarly, the statistical analysis conducted on geographies consisting of 123,528,404 people shows no correlation between the proportion of Estonians and percentage of population with at least 6th grade education in the United States with a correlation coefficient (R) of 0.006 and weighted average of 97.8%, a difference of 2.9%.
6th Grade Correlation Summary
| Measurement | Honduran | Estonian |
| Minimum | 86.2% | 88.3% |
| Maximum | 100.0% | 100.0% |
| Range | 13.8% | 11.7% |
| Mean | 94.6% | 98.5% |
| Median | 94.8% | 98.8% |
| Interquartile 25% (IQ1) | 93.0% | 97.9% |
| Interquartile 75% (IQ3) | 96.0% | 100.0% |
| Interquartile Range (IQR) | 3.0% | 2.1% |
| Standard Deviation (Sample) | 3.2% | 1.8% |
| Standard Deviation (Population) | 3.2% | 1.8% |
Similar Demographics by 6th Grade
Demographics Similar to Hondurans by 6th Grade
In terms of 6th grade, the demographic groups most similar to Hondurans are Mexican American Indian (95.0%, a difference of 0.010%), Hispanic or Latino (95.0%, a difference of 0.030%), Dominican (94.9%, a difference of 0.060%), Immigrants from Nicaragua (95.1%, a difference of 0.10%), and Cape Verdean (95.1%, a difference of 0.13%).
| Demographics | Rating | Rank | 6th Grade |
| Immigrants | Fiji | 0.0 /100 | #321 | Tragic 95.2% |
| Immigrants | Cambodia | 0.0 /100 | #322 | Tragic 95.2% |
| Central American Indians | 0.0 /100 | #323 | Tragic 95.1% |
| Cape Verdeans | 0.0 /100 | #324 | Tragic 95.1% |
| Immigrants | Nicaragua | 0.0 /100 | #325 | Tragic 95.1% |
| Hispanics or Latinos | 0.0 /100 | #326 | Tragic 95.0% |
| Mexican American Indians | 0.0 /100 | #327 | Tragic 95.0% |
| Hondurans | 0.0 /100 | #328 | Tragic 95.0% |
| Dominicans | 0.0 /100 | #329 | Tragic 94.9% |
| Nepalese | 0.0 /100 | #330 | Tragic 94.9% |
| Immigrants | Armenia | 0.0 /100 | #331 | Tragic 94.9% |
| Immigrants | Honduras | 0.0 /100 | #332 | Tragic 94.8% |
| Immigrants | Latin America | 0.0 /100 | #333 | Tragic 94.7% |
| Immigrants | Azores | 0.0 /100 | #334 | Tragic 94.7% |
| Mexicans | 0.0 /100 | #335 | Tragic 94.6% |
Demographics Similar to Estonians by 6th Grade
In terms of 6th grade, the demographic groups most similar to Estonians are Native Hawaiian (97.8%, a difference of 0.0%), Celtic (97.8%, a difference of 0.0%), Immigrants from Scotland (97.8%, a difference of 0.0%), Arapaho (97.8%, a difference of 0.010%), and Maltese (97.8%, a difference of 0.010%).
| Demographics | Rating | Rank | 6th Grade |
| Hungarians | 99.9 /100 | #42 | Exceptional 97.8% |
| Northern Europeans | 99.9 /100 | #43 | Exceptional 97.8% |
| Czechoslovakians | 99.9 /100 | #44 | Exceptional 97.8% |
| Bulgarians | 99.9 /100 | #45 | Exceptional 97.8% |
| Arapaho | 99.9 /100 | #46 | Exceptional 97.8% |
| Native Hawaiians | 99.9 /100 | #47 | Exceptional 97.8% |
| Celtics | 99.9 /100 | #48 | Exceptional 97.8% |
| Estonians | 99.8 /100 | #49 | Exceptional 97.8% |
| Immigrants | Scotland | 99.8 /100 | #50 | Exceptional 97.8% |
| Maltese | 99.8 /100 | #51 | Exceptional 97.8% |
| Australians | 99.8 /100 | #52 | Exceptional 97.8% |
| Slavs | 99.8 /100 | #53 | Exceptional 97.8% |
| Creek | 99.8 /100 | #54 | Exceptional 97.7% |
| Aleuts | 99.8 /100 | #55 | Exceptional 97.7% |
| Austrians | 99.8 /100 | #56 | Exceptional 97.7% |