Immigrants from Europe vs Estonian College, 1 year or more
COMPARE
Immigrants from Europe
Estonian
College, 1 year or more
College, 1 year or more Comparison
Immigrants from Europe
Estonians
63.3%
COLLEGE, 1 YEAR OR MORE
99.3/ 100
METRIC RATING
66th/ 347
METRIC RANK
65.0%
COLLEGE, 1 YEAR OR MORE
99.9/ 100
METRIC RATING
39th/ 347
METRIC RANK
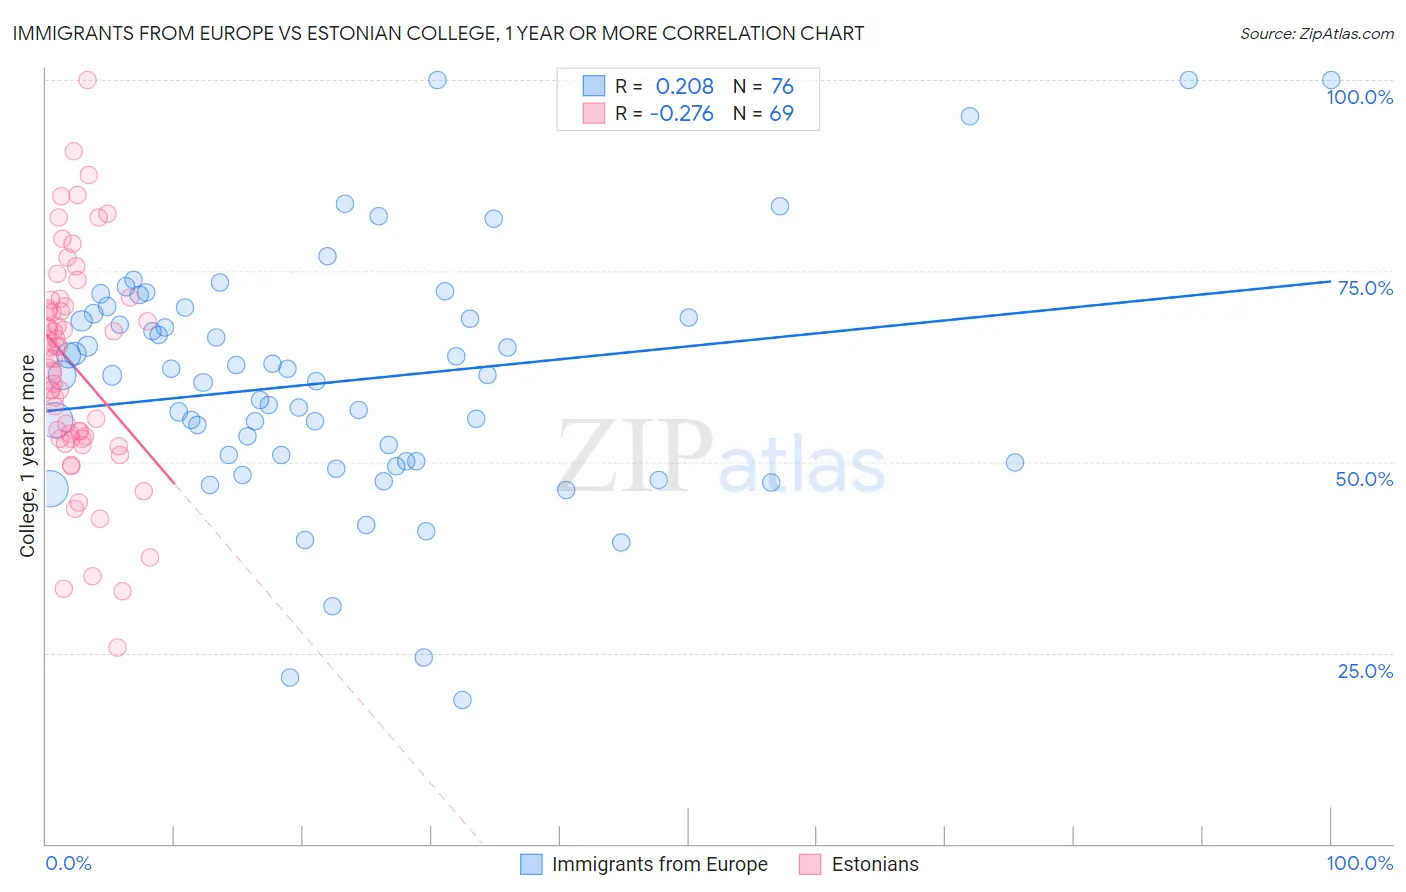
Immigrants from Europe vs Estonian College, 1 year or more Correlation Chart
The statistical analysis conducted on geographies consisting of 547,418,471 people shows a weak positive correlation between the proportion of Immigrants from Europe and percentage of population with at least college, 1 year or more education in the United States with a correlation coefficient (R) of 0.208 and weighted average of 63.3%. Similarly, the statistical analysis conducted on geographies consisting of 123,528,478 people shows a weak negative correlation between the proportion of Estonians and percentage of population with at least college, 1 year or more education in the United States with a correlation coefficient (R) of -0.276 and weighted average of 65.0%, a difference of 2.7%.
College, 1 year or more Correlation Summary
| Measurement | Immigrants from Europe | Estonian |
| Minimum | 18.8% | 25.8% |
| Maximum | 100.0% | 100.0% |
| Range | 81.2% | 74.2% |
| Mean | 60.6% | 62.4% |
| Median | 61.4% | 63.5% |
| Interquartile 25% (IQ1) | 50.0% | 53.0% |
| Interquartile 75% (IQ3) | 69.1% | 70.8% |
| Interquartile Range (IQR) | 19.1% | 17.8% |
| Standard Deviation (Sample) | 16.1% | 14.5% |
| Standard Deviation (Population) | 15.9% | 14.4% |
Similar Demographics by College, 1 year or more
Demographics Similar to Immigrants from Europe by College, 1 year or more
In terms of college, 1 year or more, the demographic groups most similar to Immigrants from Europe are Immigrants from Romania (63.3%, a difference of 0.020%), Immigrants from Greece (63.3%, a difference of 0.030%), Immigrants from Zimbabwe (63.3%, a difference of 0.040%), Maltese (63.4%, a difference of 0.10%), and Argentinean (63.2%, a difference of 0.13%).
| Demographics | Rating | Rank | College, 1 year or more |
| Immigrants | Serbia | 99.6 /100 | #59 | Exceptional 63.8% |
| Immigrants | Kazakhstan | 99.5 /100 | #60 | Exceptional 63.6% |
| Bolivians | 99.5 /100 | #61 | Exceptional 63.5% |
| Immigrants | Indonesia | 99.5 /100 | #62 | Exceptional 63.5% |
| Immigrants | Scotland | 99.4 /100 | #63 | Exceptional 63.4% |
| Immigrants | Spain | 99.4 /100 | #64 | Exceptional 63.4% |
| Maltese | 99.3 /100 | #65 | Exceptional 63.4% |
| Immigrants | Europe | 99.3 /100 | #66 | Exceptional 63.3% |
| Immigrants | Romania | 99.3 /100 | #67 | Exceptional 63.3% |
| Immigrants | Greece | 99.3 /100 | #68 | Exceptional 63.3% |
| Immigrants | Zimbabwe | 99.3 /100 | #69 | Exceptional 63.3% |
| Argentineans | 99.2 /100 | #70 | Exceptional 63.2% |
| Immigrants | Canada | 99.1 /100 | #71 | Exceptional 63.1% |
| Egyptians | 99.0 /100 | #72 | Exceptional 63.1% |
| Immigrants | Moldova | 99.0 /100 | #73 | Exceptional 63.0% |
Demographics Similar to Estonians by College, 1 year or more
In terms of college, 1 year or more, the demographic groups most similar to Estonians are Immigrants from Kuwait (65.0%, a difference of 0.060%), Immigrants from Saudi Arabia (65.0%, a difference of 0.070%), Russian (65.1%, a difference of 0.22%), Immigrants from South Africa (65.1%, a difference of 0.23%), and Mongolian (64.8%, a difference of 0.26%).
| Demographics | Rating | Rank | College, 1 year or more |
| Bulgarians | 100.0 /100 | #32 | Exceptional 65.5% |
| Immigrants | Sri Lanka | 99.9 /100 | #33 | Exceptional 65.4% |
| Israelis | 99.9 /100 | #34 | Exceptional 65.3% |
| Immigrants | Turkey | 99.9 /100 | #35 | Exceptional 65.2% |
| Immigrants | South Africa | 99.9 /100 | #36 | Exceptional 65.1% |
| Russians | 99.9 /100 | #37 | Exceptional 65.1% |
| Immigrants | Saudi Arabia | 99.9 /100 | #38 | Exceptional 65.0% |
| Estonians | 99.9 /100 | #39 | Exceptional 65.0% |
| Immigrants | Kuwait | 99.9 /100 | #40 | Exceptional 65.0% |
| Mongolians | 99.9 /100 | #41 | Exceptional 64.8% |
| Immigrants | Latvia | 99.9 /100 | #42 | Exceptional 64.8% |
| Immigrants | Russia | 99.9 /100 | #43 | Exceptional 64.7% |
| Immigrants | Norway | 99.9 /100 | #44 | Exceptional 64.7% |
| Immigrants | Lithuania | 99.9 /100 | #45 | Exceptional 64.6% |
| Bhutanese | 99.9 /100 | #46 | Exceptional 64.6% |