Immigrants from Zimbabwe vs Asian 7th Grade
COMPARE
Immigrants from Zimbabwe
Asian
7th Grade
7th Grade Comparison
Immigrants from Zimbabwe
Asians
96.5%
7TH GRADE
96.6/ 100
METRIC RATING
114th/ 347
METRIC RANK
95.5%
7TH GRADE
2.6/ 100
METRIC RATING
236th/ 347
METRIC RANK
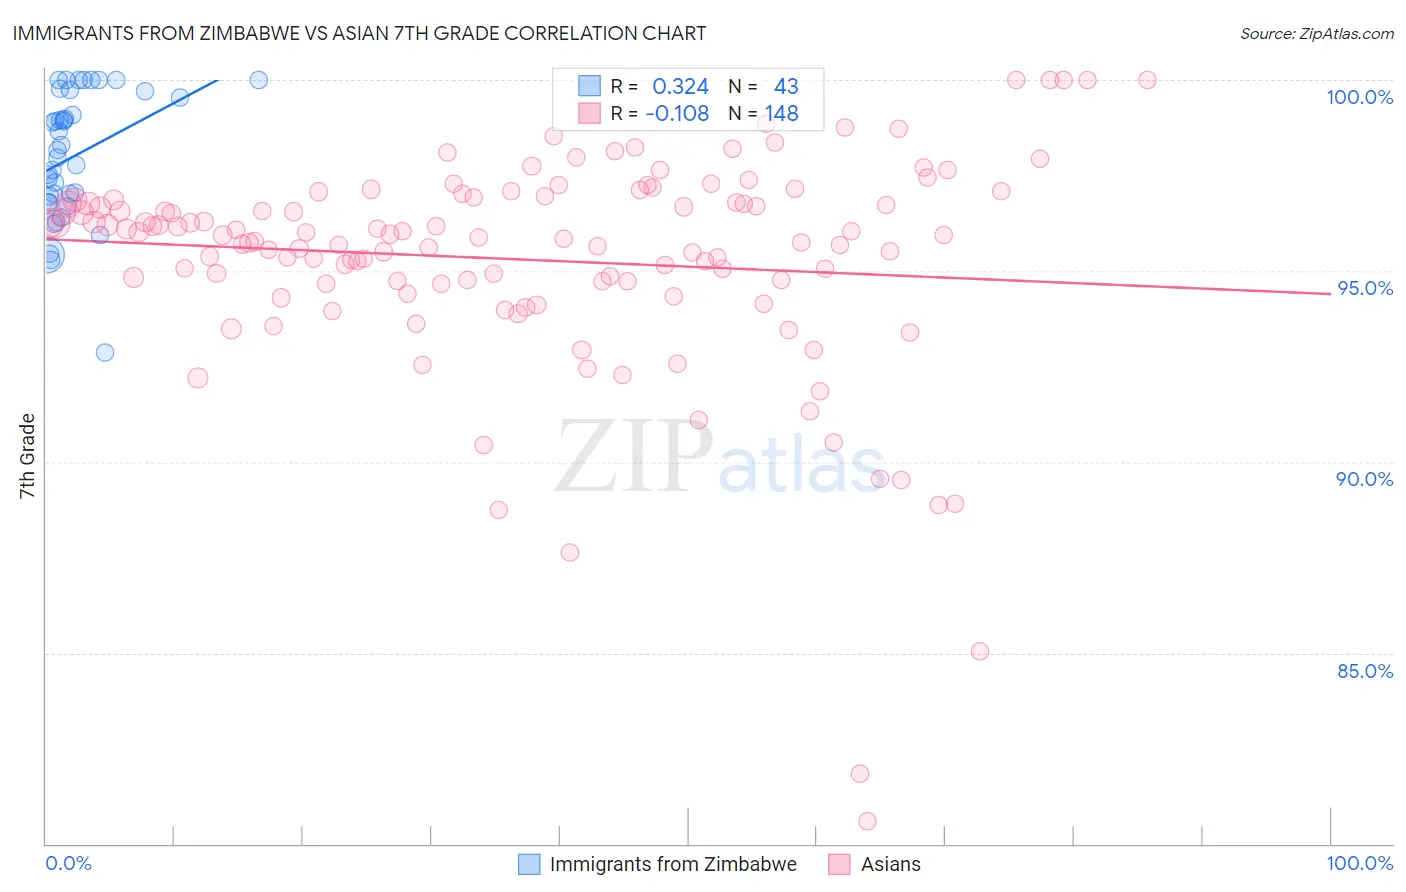
Immigrants from Zimbabwe vs Asian 7th Grade Correlation Chart
The statistical analysis conducted on geographies consisting of 117,756,150 people shows a mild positive correlation between the proportion of Immigrants from Zimbabwe and percentage of population with at least 7th grade education in the United States with a correlation coefficient (R) of 0.324 and weighted average of 96.5%. Similarly, the statistical analysis conducted on geographies consisting of 550,917,032 people shows a poor negative correlation between the proportion of Asians and percentage of population with at least 7th grade education in the United States with a correlation coefficient (R) of -0.108 and weighted average of 95.5%, a difference of 1.1%.
7th Grade Correlation Summary
| Measurement | Immigrants from Zimbabwe | Asian |
| Minimum | 92.9% | 80.6% |
| Maximum | 100.0% | 100.0% |
| Range | 7.1% | 19.4% |
| Mean | 98.0% | 95.3% |
| Median | 98.2% | 95.9% |
| Interquartile 25% (IQ1) | 96.8% | 94.7% |
| Interquartile 75% (IQ3) | 99.7% | 96.9% |
| Interquartile Range (IQR) | 2.9% | 2.2% |
| Standard Deviation (Sample) | 1.7% | 2.9% |
| Standard Deviation (Population) | 1.7% | 2.9% |
Similar Demographics by 7th Grade
Demographics Similar to Immigrants from Zimbabwe by 7th Grade
In terms of 7th grade, the demographic groups most similar to Immigrants from Zimbabwe are Choctaw (96.5%, a difference of 0.0%), Syrian (96.5%, a difference of 0.0%), Pueblo (96.5%, a difference of 0.010%), Nonimmigrants (96.5%, a difference of 0.020%), and Okinawan (96.6%, a difference of 0.040%).
| Demographics | Rating | Rank | 7th Grade |
| Lumbee | 97.8 /100 | #107 | Exceptional 96.6% |
| Immigrants | Saudi Arabia | 97.8 /100 | #108 | Exceptional 96.6% |
| Bhutanese | 97.7 /100 | #109 | Exceptional 96.6% |
| Okinawans | 97.4 /100 | #110 | Exceptional 96.6% |
| Immigrants | Latvia | 97.4 /100 | #111 | Exceptional 96.6% |
| Immigrants | Nonimmigrants | 97.0 /100 | #112 | Exceptional 96.5% |
| Pueblo | 96.8 /100 | #113 | Exceptional 96.5% |
| Immigrants | Zimbabwe | 96.6 /100 | #114 | Exceptional 96.5% |
| Choctaw | 96.6 /100 | #115 | Exceptional 96.5% |
| Syrians | 96.6 /100 | #116 | Exceptional 96.5% |
| Immigrants | Moldova | 95.7 /100 | #117 | Exceptional 96.5% |
| Immigrants | Japan | 95.5 /100 | #118 | Exceptional 96.5% |
| Immigrants | Norway | 95.2 /100 | #119 | Exceptional 96.5% |
| Immigrants | Croatia | 95.0 /100 | #120 | Exceptional 96.5% |
| Cheyenne | 94.9 /100 | #121 | Exceptional 96.5% |
Demographics Similar to Asians by 7th Grade
In terms of 7th grade, the demographic groups most similar to Asians are Immigrants from Africa (95.5%, a difference of 0.010%), Immigrants from Asia (95.5%, a difference of 0.010%), Nigerian (95.5%, a difference of 0.020%), Indian (Asian) (95.5%, a difference of 0.020%), and Jamaican (95.5%, a difference of 0.030%).
| Demographics | Rating | Rank | 7th Grade |
| Immigrants | Panama | 4.9 /100 | #229 | Tragic 95.6% |
| Natives/Alaskans | 4.2 /100 | #230 | Tragic 95.6% |
| Senegalese | 4.0 /100 | #231 | Tragic 95.6% |
| Costa Ricans | 3.3 /100 | #232 | Tragic 95.5% |
| Immigrants | Indonesia | 3.3 /100 | #233 | Tragic 95.5% |
| Nigerians | 3.0 /100 | #234 | Tragic 95.5% |
| Immigrants | Africa | 2.7 /100 | #235 | Tragic 95.5% |
| Asians | 2.6 /100 | #236 | Tragic 95.5% |
| Immigrants | Asia | 2.3 /100 | #237 | Tragic 95.5% |
| Indians (Asian) | 2.3 /100 | #238 | Tragic 95.5% |
| Jamaicans | 2.2 /100 | #239 | Tragic 95.5% |
| Immigrants | Sierra Leone | 2.0 /100 | #240 | Tragic 95.5% |
| South American Indians | 2.0 /100 | #241 | Tragic 95.5% |
| Immigrants | Senegal | 1.9 /100 | #242 | Tragic 95.5% |
| U.S. Virgin Islanders | 1.6 /100 | #243 | Tragic 95.4% |