Marshallese vs Kenyan No Schooling Completed
COMPARE
Marshallese
Kenyan
No Schooling Completed
No Schooling Completed Comparison
Marshallese
Kenyans
2.0%
NO SCHOOLING COMPLETED
83.5/ 100
METRIC RATING
140th/ 347
METRIC RANK
2.0%
NO SCHOOLING COMPLETED
65.7/ 100
METRIC RATING
160th/ 347
METRIC RANK
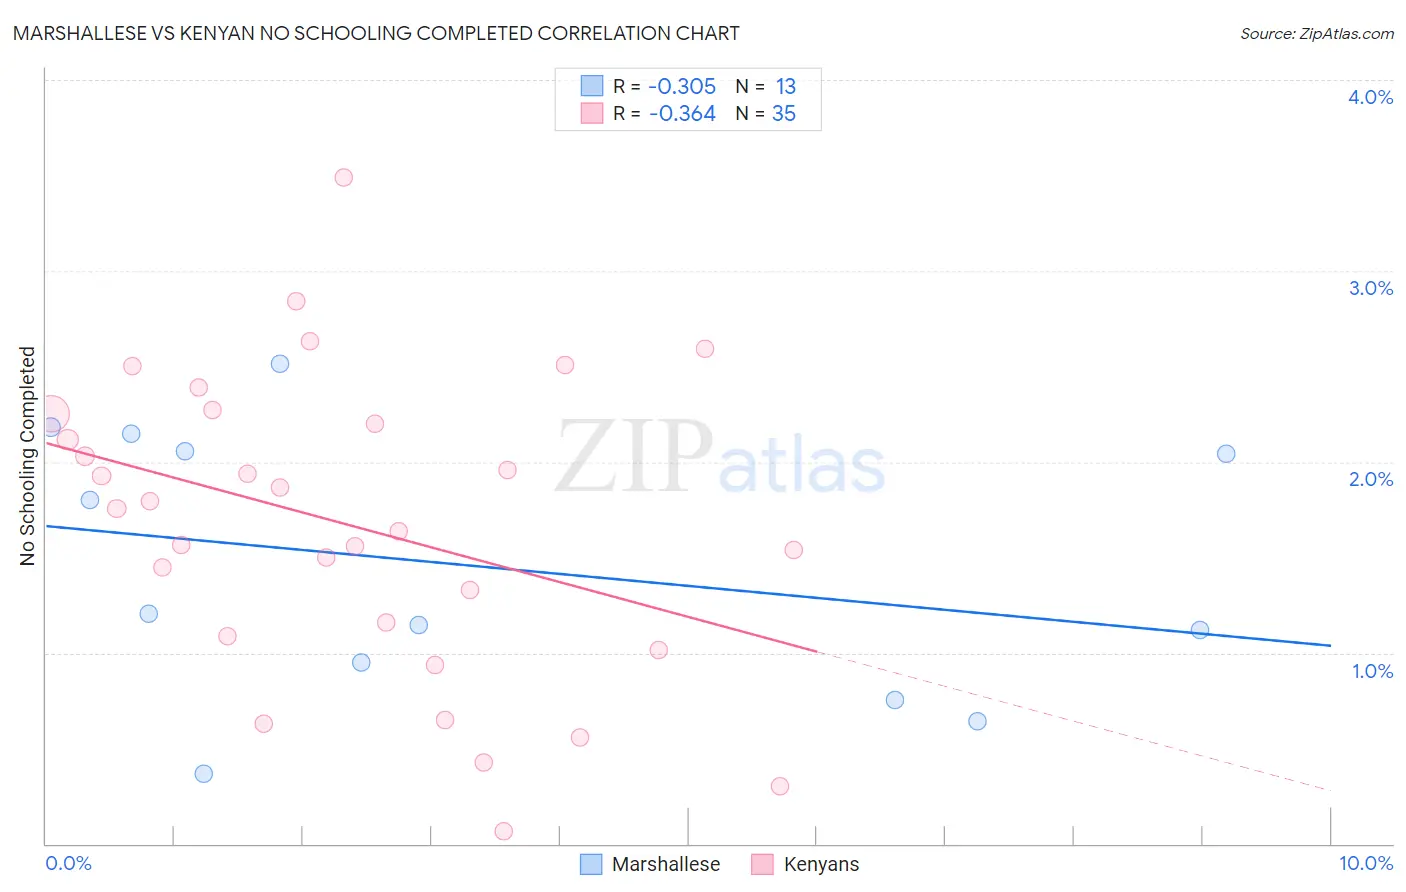
Marshallese vs Kenyan No Schooling Completed Correlation Chart
The statistical analysis conducted on geographies consisting of 14,733,291 people shows a mild negative correlation between the proportion of Marshallese and percentage of population with no schooling in the United States with a correlation coefficient (R) of -0.305 and weighted average of 2.0%. Similarly, the statistical analysis conducted on geographies consisting of 167,616,465 people shows a mild negative correlation between the proportion of Kenyans and percentage of population with no schooling in the United States with a correlation coefficient (R) of -0.364 and weighted average of 2.0%, a difference of 3.5%.
No Schooling Completed Correlation Summary
| Measurement | Marshallese | Kenyan |
| Minimum | 0.36% | 0.067% |
| Maximum | 2.5% | 3.5% |
| Range | 2.1% | 3.4% |
| Mean | 1.5% | 1.7% |
| Median | 1.2% | 1.8% |
| Interquartile 25% (IQ1) | 0.85% | 1.1% |
| Interquartile 75% (IQ3) | 2.1% | 2.3% |
| Interquartile Range (IQR) | 1.2% | 1.2% |
| Standard Deviation (Sample) | 0.70% | 0.79% |
| Standard Deviation (Population) | 0.67% | 0.78% |
Demographics Similar to Marshallese and Kenyans by No Schooling Completed
In terms of no schooling completed, the demographic groups most similar to Marshallese are Immigrants from Greece (2.0%, a difference of 0.010%), Venezuelan (2.0%, a difference of 0.50%), Immigrants from South Central Asia (2.0%, a difference of 0.85%), Alsatian (2.0%, a difference of 1.1%), and Immigrants from Iran (2.0%, a difference of 1.1%). Similarly, the demographic groups most similar to Kenyans are Immigrants from Spain (2.0%, a difference of 0.12%), Immigrants from Korea (2.0%, a difference of 0.16%), Immigrants from Sri Lanka (2.0%, a difference of 0.20%), Chilean (2.0%, a difference of 0.24%), and Immigrants from Russia (2.0%, a difference of 0.30%).
| Demographics | Rating | Rank | No Schooling Completed |
| Marshallese | 83.5 /100 | #140 | Excellent 2.0% |
| Immigrants | Greece | 83.5 /100 | #141 | Excellent 2.0% |
| Venezuelans | 81.5 /100 | #142 | Excellent 2.0% |
| Immigrants | South Central Asia | 80.0 /100 | #143 | Good 2.0% |
| Alsatians | 79.1 /100 | #144 | Good 2.0% |
| Immigrants | Iran | 79.0 /100 | #145 | Good 2.0% |
| Immigrants | Moldova | 78.0 /100 | #146 | Good 2.0% |
| Soviet Union | 77.1 /100 | #147 | Good 2.0% |
| Shoshone | 76.7 /100 | #148 | Good 2.0% |
| Immigrants | North Macedonia | 75.9 /100 | #149 | Good 2.0% |
| Blackfeet | 72.9 /100 | #150 | Good 2.0% |
| Immigrants | Jordan | 70.9 /100 | #151 | Good 2.0% |
| Immigrants | Eastern Europe | 70.4 /100 | #152 | Good 2.0% |
| Immigrants | Italy | 68.9 /100 | #153 | Good 2.0% |
| Immigrants | Venezuela | 68.5 /100 | #154 | Good 2.0% |
| Immigrants | Russia | 67.6 /100 | #155 | Good 2.0% |
| Chileans | 67.2 /100 | #156 | Good 2.0% |
| Immigrants | Sri Lanka | 67.0 /100 | #157 | Good 2.0% |
| Immigrants | Korea | 66.7 /100 | #158 | Good 2.0% |
| Immigrants | Spain | 66.4 /100 | #159 | Good 2.0% |
| Kenyans | 65.7 /100 | #160 | Good 2.0% |