Hmong vs Immigrants from Zaire 7th Grade
COMPARE
Hmong
Immigrants from Zaire
7th Grade
7th Grade Comparison
Hmong
Immigrants from Zaire
96.4%
7TH GRADE
91.5/ 100
METRIC RATING
133rd/ 347
METRIC RANK
95.9%
7TH GRADE
26.7/ 100
METRIC RATING
197th/ 347
METRIC RANK
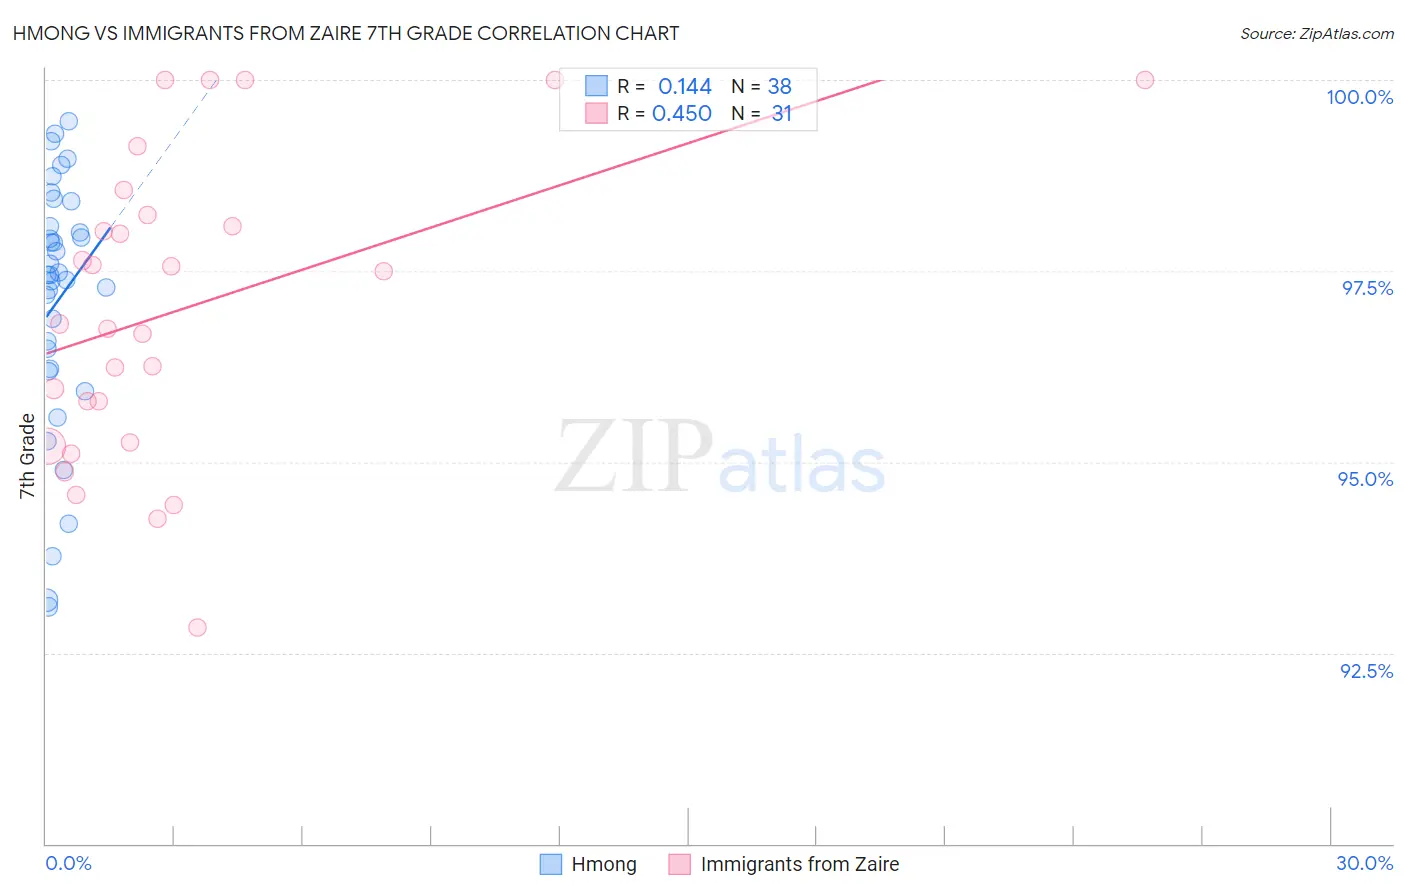
Hmong vs Immigrants from Zaire 7th Grade Correlation Chart
The statistical analysis conducted on geographies consisting of 24,672,093 people shows a poor positive correlation between the proportion of Hmong and percentage of population with at least 7th grade education in the United States with a correlation coefficient (R) of 0.144 and weighted average of 96.4%. Similarly, the statistical analysis conducted on geographies consisting of 107,212,695 people shows a moderate positive correlation between the proportion of Immigrants from Zaire and percentage of population with at least 7th grade education in the United States with a correlation coefficient (R) of 0.450 and weighted average of 95.9%, a difference of 0.52%.
7th Grade Correlation Summary
| Measurement | Hmong | Immigrants from Zaire |
| Minimum | 93.1% | 92.8% |
| Maximum | 99.5% | 100.0% |
| Range | 6.4% | 7.2% |
| Mean | 97.1% | 97.0% |
| Median | 97.4% | 96.8% |
| Interquartile 25% (IQ1) | 96.2% | 95.2% |
| Interquartile 75% (IQ3) | 98.1% | 98.2% |
| Interquartile Range (IQR) | 1.9% | 3.0% |
| Standard Deviation (Sample) | 1.6% | 2.0% |
| Standard Deviation (Population) | 1.6% | 1.9% |
Similar Demographics by 7th Grade
Demographics Similar to Hmong by 7th Grade
In terms of 7th grade, the demographic groups most similar to Hmong are Filipino (96.4%, a difference of 0.010%), Colville (96.4%, a difference of 0.010%), Soviet Union (96.4%, a difference of 0.010%), Immigrants from Kuwait (96.4%, a difference of 0.010%), and Immigrants from Hungary (96.4%, a difference of 0.020%).
| Demographics | Rating | Rank | 7th Grade |
| Palestinians | 93.5 /100 | #126 | Exceptional 96.4% |
| Immigrants | Bosnia and Herzegovina | 93.3 /100 | #127 | Exceptional 96.4% |
| Immigrants | Romania | 93.2 /100 | #128 | Exceptional 96.4% |
| Immigrants | North Macedonia | 93.1 /100 | #129 | Exceptional 96.4% |
| Immigrants | Serbia | 92.8 /100 | #130 | Exceptional 96.4% |
| Filipinos | 92.1 /100 | #131 | Exceptional 96.4% |
| Colville | 91.7 /100 | #132 | Exceptional 96.4% |
| Hmong | 91.5 /100 | #133 | Exceptional 96.4% |
| Soviet Union | 91.2 /100 | #134 | Exceptional 96.4% |
| Immigrants | Kuwait | 91.1 /100 | #135 | Exceptional 96.4% |
| Immigrants | Hungary | 90.6 /100 | #136 | Exceptional 96.4% |
| Immigrants | Turkey | 90.2 /100 | #137 | Exceptional 96.4% |
| Jordanians | 90.0 /100 | #138 | Excellent 96.4% |
| Basques | 89.3 /100 | #139 | Excellent 96.4% |
| Cambodians | 88.3 /100 | #140 | Excellent 96.3% |
Demographics Similar to Immigrants from Zaire by 7th Grade
In terms of 7th grade, the demographic groups most similar to Immigrants from Zaire are Sudanese (95.9%, a difference of 0.010%), Apache (95.9%, a difference of 0.010%), Immigrants from Nepal (95.9%, a difference of 0.020%), Paraguayan (95.9%, a difference of 0.020%), and Immigrants from Bahamas (95.9%, a difference of 0.030%).
| Demographics | Rating | Rank | 7th Grade |
| Immigrants | Micronesia | 32.6 /100 | #190 | Fair 95.9% |
| Liberians | 32.5 /100 | #191 | Fair 95.9% |
| Panamanians | 32.3 /100 | #192 | Fair 95.9% |
| Immigrants | Bahamas | 30.8 /100 | #193 | Fair 95.9% |
| Immigrants | Nepal | 30.0 /100 | #194 | Fair 95.9% |
| Sudanese | 28.1 /100 | #195 | Fair 95.9% |
| Apache | 27.6 /100 | #196 | Fair 95.9% |
| Immigrants | Zaire | 26.7 /100 | #197 | Fair 95.9% |
| Paraguayans | 24.8 /100 | #198 | Fair 95.9% |
| Guamanians/Chamorros | 23.5 /100 | #199 | Fair 95.9% |
| Argentineans | 23.2 /100 | #200 | Fair 95.9% |
| Immigrants | Argentina | 21.9 /100 | #201 | Fair 95.9% |
| Immigrants | Northern Africa | 21.4 /100 | #202 | Fair 95.8% |
| Comanche | 21.1 /100 | #203 | Fair 95.8% |
| Assyrians/Chaldeans/Syriacs | 20.5 /100 | #204 | Fair 95.8% |