Immigrants from Cambodia vs British 10th Grade
COMPARE
Immigrants from Cambodia
British
10th Grade
10th Grade Comparison
Immigrants from Cambodia
British
90.9%
10TH GRADE
0.0/ 100
METRIC RATING
311th/ 347
METRIC RANK
95.3%
10TH GRADE
99.9/ 100
METRIC RATING
34th/ 347
METRIC RANK
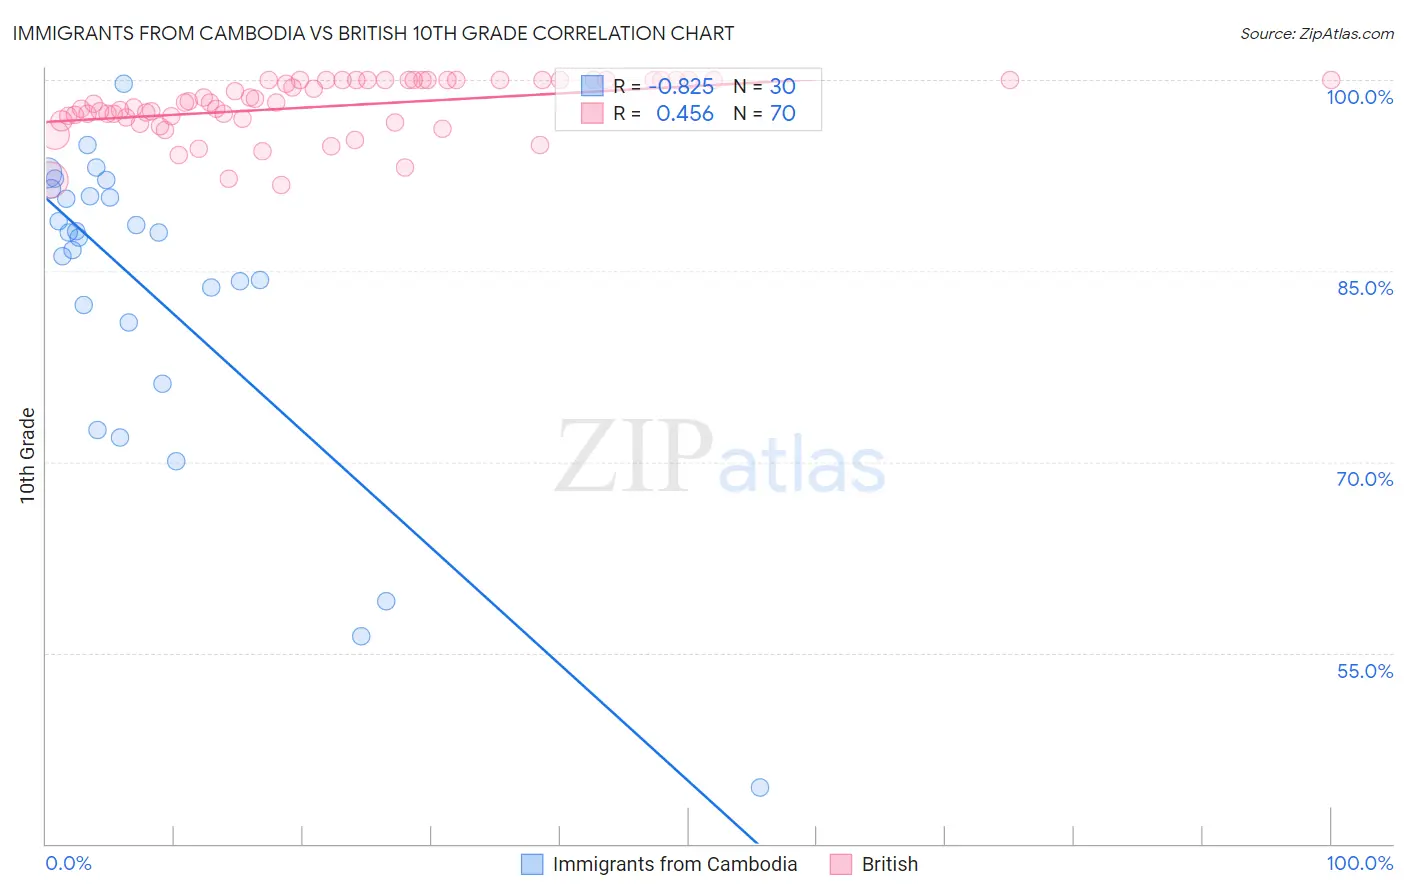
Immigrants from Cambodia vs British 10th Grade Correlation Chart
The statistical analysis conducted on geographies consisting of 205,153,442 people shows a very strong negative correlation between the proportion of Immigrants from Cambodia and percentage of population with at least 10th grade education in the United States with a correlation coefficient (R) of -0.825 and weighted average of 90.9%. Similarly, the statistical analysis conducted on geographies consisting of 531,463,601 people shows a moderate positive correlation between the proportion of British and percentage of population with at least 10th grade education in the United States with a correlation coefficient (R) of 0.456 and weighted average of 95.3%, a difference of 4.8%.
10th Grade Correlation Summary
| Measurement | Immigrants from Cambodia | British |
| Minimum | 44.4% | 91.8% |
| Maximum | 99.7% | 100.0% |
| Range | 55.2% | 8.2% |
| Mean | 83.2% | 97.9% |
| Median | 87.8% | 98.2% |
| Interquartile 25% (IQ1) | 80.9% | 96.9% |
| Interquartile 75% (IQ3) | 90.8% | 100.0% |
| Interquartile Range (IQR) | 9.9% | 3.1% |
| Standard Deviation (Sample) | 12.4% | 2.2% |
| Standard Deviation (Population) | 12.2% | 2.2% |
Similar Demographics by 10th Grade
Demographics Similar to Immigrants from Cambodia by 10th Grade
In terms of 10th grade, the demographic groups most similar to Immigrants from Cambodia are Vietnamese (90.9%, a difference of 0.020%), Immigrants (91.0%, a difference of 0.060%), Immigrants from Bangladesh (91.0%, a difference of 0.10%), Immigrants from Fiji (91.0%, a difference of 0.11%), and Immigrants from Portugal (90.8%, a difference of 0.16%).
| Demographics | Rating | Rank | 10th Grade |
| Pima | 0.0 /100 | #304 | Tragic 91.2% |
| Immigrants | Dominica | 0.0 /100 | #305 | Tragic 91.1% |
| Yaqui | 0.0 /100 | #306 | Tragic 91.1% |
| Immigrants | Fiji | 0.0 /100 | #307 | Tragic 91.0% |
| Immigrants | Bangladesh | 0.0 /100 | #308 | Tragic 91.0% |
| Immigrants | Immigrants | 0.0 /100 | #309 | Tragic 91.0% |
| Vietnamese | 0.0 /100 | #310 | Tragic 90.9% |
| Immigrants | Cambodia | 0.0 /100 | #311 | Tragic 90.9% |
| Immigrants | Portugal | 0.0 /100 | #312 | Tragic 90.8% |
| Cape Verdeans | 0.0 /100 | #313 | Tragic 90.8% |
| Nepalese | 0.0 /100 | #314 | Tragic 90.7% |
| Immigrants | Caribbean | 0.0 /100 | #315 | Tragic 90.6% |
| Ecuadorians | 0.0 /100 | #316 | Tragic 90.6% |
| Immigrants | Ecuador | 0.0 /100 | #317 | Tragic 90.4% |
| Immigrants | Cuba | 0.0 /100 | #318 | Tragic 90.2% |
Demographics Similar to British by 10th Grade
In terms of 10th grade, the demographic groups most similar to British are Iranian (95.3%, a difference of 0.010%), Hungarian (95.3%, a difference of 0.010%), French (95.3%, a difference of 0.010%), Estonian (95.3%, a difference of 0.010%), and Immigrants from India (95.3%, a difference of 0.020%).
| Demographics | Rating | Rank | 10th Grade |
| Alaskan Athabascans | 100.0 /100 | #27 | Exceptional 95.4% |
| Luxembourgers | 100.0 /100 | #28 | Exceptional 95.4% |
| Bulgarians | 100.0 /100 | #29 | Exceptional 95.4% |
| Belgians | 100.0 /100 | #30 | Exceptional 95.4% |
| Iranians | 100.0 /100 | #31 | Exceptional 95.3% |
| Hungarians | 100.0 /100 | #32 | Exceptional 95.3% |
| French | 100.0 /100 | #33 | Exceptional 95.3% |
| British | 99.9 /100 | #34 | Exceptional 95.3% |
| Estonians | 99.9 /100 | #35 | Exceptional 95.3% |
| Immigrants | India | 99.9 /100 | #36 | Exceptional 95.3% |
| French Canadians | 99.9 /100 | #37 | Exceptional 95.3% |
| Northern Europeans | 99.9 /100 | #38 | Exceptional 95.3% |
| Immigrants | Scotland | 99.9 /100 | #39 | Exceptional 95.2% |
| Scotch-Irish | 99.9 /100 | #40 | Exceptional 95.2% |
| Russians | 99.9 /100 | #41 | Exceptional 95.2% |