Immigrants from Malaysia vs Yuman Bachelor's Degree
COMPARE
Immigrants from Malaysia
Yuman
Bachelor's Degree
Bachelor's Degree Comparison
Immigrants from Malaysia
Yuman
45.0%
BACHELOR'S DEGREE
100.0/ 100
METRIC RATING
41st/ 347
METRIC RANK
24.5%
BACHELOR'S DEGREE
0.0/ 100
METRIC RATING
341st/ 347
METRIC RANK
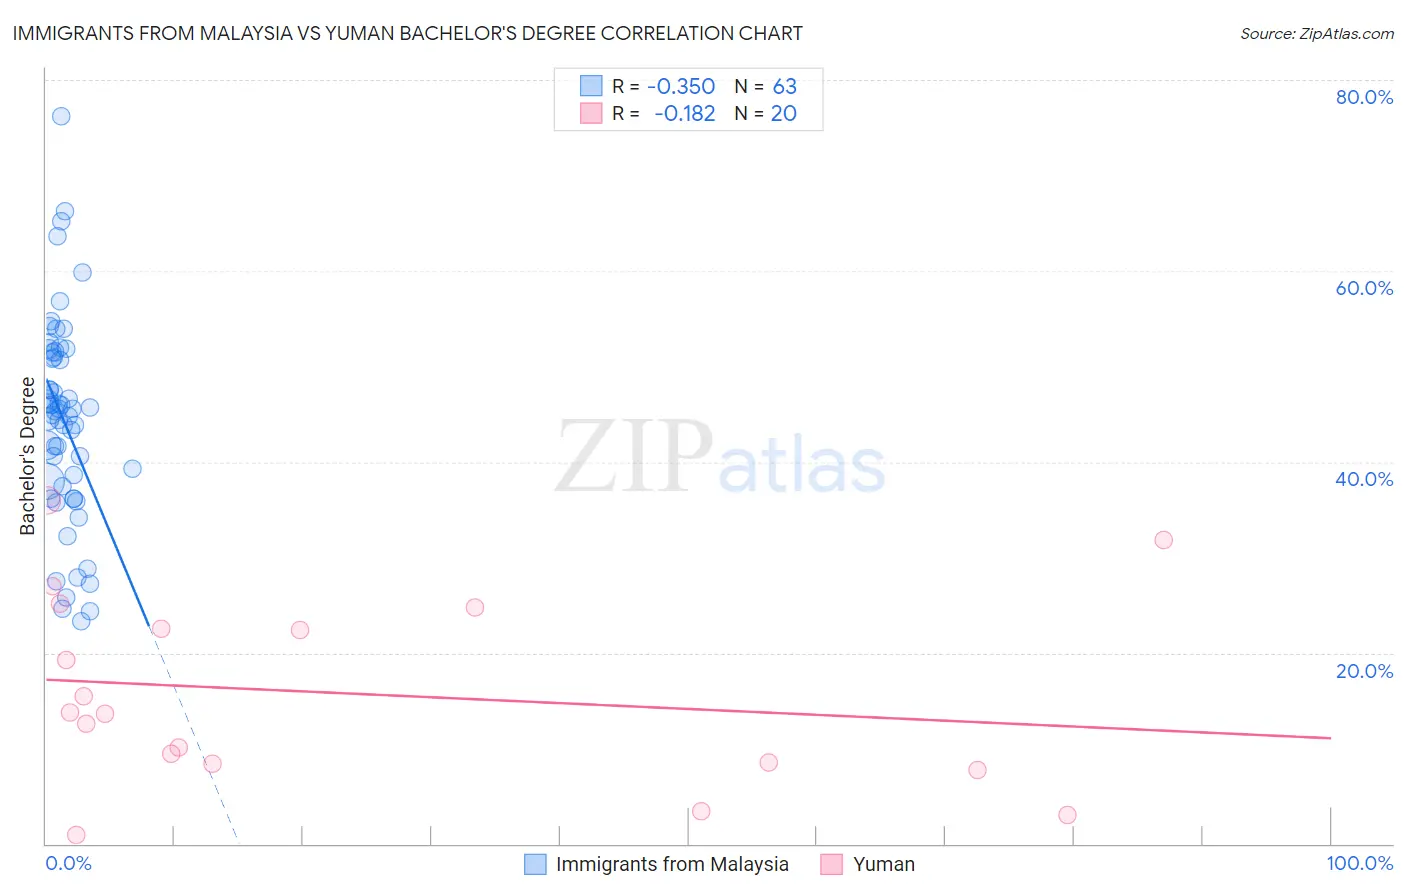
Immigrants from Malaysia vs Yuman Bachelor's Degree Correlation Chart
The statistical analysis conducted on geographies consisting of 197,964,670 people shows a mild negative correlation between the proportion of Immigrants from Malaysia and percentage of population with at least bachelor's degree education in the United States with a correlation coefficient (R) of -0.350 and weighted average of 45.0%. Similarly, the statistical analysis conducted on geographies consisting of 40,695,853 people shows a poor negative correlation between the proportion of Yuman and percentage of population with at least bachelor's degree education in the United States with a correlation coefficient (R) of -0.182 and weighted average of 24.5%, a difference of 83.5%.
Bachelor's Degree Correlation Summary
| Measurement | Immigrants from Malaysia | Yuman |
| Minimum | 23.2% | 0.96% |
| Maximum | 76.2% | 36.0% |
| Range | 53.0% | 35.0% |
| Mean | 44.4% | 15.8% |
| Median | 45.3% | 13.7% |
| Interquartile 25% (IQ1) | 37.4% | 8.4% |
| Interquartile 75% (IQ3) | 51.4% | 23.6% |
| Interquartile Range (IQR) | 14.1% | 15.2% |
| Standard Deviation (Sample) | 10.7% | 9.9% |
| Standard Deviation (Population) | 10.6% | 9.6% |
Similar Demographics by Bachelor's Degree
Demographics Similar to Immigrants from Malaysia by Bachelor's Degree
In terms of bachelor's degree, the demographic groups most similar to Immigrants from Malaysia are Immigrants from Belarus (45.0%, a difference of 0.040%), Immigrants from Latvia (45.1%, a difference of 0.31%), Immigrants from Saudi Arabia (44.8%, a difference of 0.38%), Immigrants from South Africa (44.8%, a difference of 0.52%), and Bulgarian (45.3%, a difference of 0.64%).
| Demographics | Rating | Rank | Bachelor's Degree |
| Immigrants | Denmark | 100.0 /100 | #34 | Exceptional 45.4% |
| Immigrants | Russia | 100.0 /100 | #35 | Exceptional 45.4% |
| Mongolians | 100.0 /100 | #36 | Exceptional 45.4% |
| Russians | 100.0 /100 | #37 | Exceptional 45.3% |
| Bulgarians | 100.0 /100 | #38 | Exceptional 45.3% |
| Immigrants | Latvia | 100.0 /100 | #39 | Exceptional 45.1% |
| Immigrants | Belarus | 100.0 /100 | #40 | Exceptional 45.0% |
| Immigrants | Malaysia | 100.0 /100 | #41 | Exceptional 45.0% |
| Immigrants | Saudi Arabia | 100.0 /100 | #42 | Exceptional 44.8% |
| Immigrants | South Africa | 99.9 /100 | #43 | Exceptional 44.8% |
| Immigrants | Lithuania | 99.9 /100 | #44 | Exceptional 44.6% |
| Immigrants | Kuwait | 99.9 /100 | #45 | Exceptional 44.6% |
| Immigrants | Bulgaria | 99.9 /100 | #46 | Exceptional 44.6% |
| Bolivians | 99.9 /100 | #47 | Exceptional 44.6% |
| Estonians | 99.9 /100 | #48 | Exceptional 44.6% |
Demographics Similar to Yuman by Bachelor's Degree
In terms of bachelor's degree, the demographic groups most similar to Yuman are Yakama (24.5%, a difference of 0.27%), Tohono O'odham (24.4%, a difference of 0.47%), Lumbee (24.8%, a difference of 0.92%), Hopi (25.3%, a difference of 3.1%), and Navajo (23.6%, a difference of 3.9%).
| Demographics | Rating | Rank | Bachelor's Degree |
| Mexicans | 0.0 /100 | #333 | Tragic 27.1% |
| Arapaho | 0.0 /100 | #334 | Tragic 26.6% |
| Natives/Alaskans | 0.0 /100 | #335 | Tragic 26.3% |
| Immigrants | Mexico | 0.0 /100 | #336 | Tragic 26.1% |
| Inupiat | 0.0 /100 | #337 | Tragic 25.8% |
| Pueblo | 0.0 /100 | #338 | Tragic 25.5% |
| Hopi | 0.0 /100 | #339 | Tragic 25.3% |
| Lumbee | 0.0 /100 | #340 | Tragic 24.8% |
| Yuman | 0.0 /100 | #341 | Tragic 24.5% |
| Yakama | 0.0 /100 | #342 | Tragic 24.5% |
| Tohono O'odham | 0.0 /100 | #343 | Tragic 24.4% |
| Navajo | 0.0 /100 | #344 | Tragic 23.6% |
| Pima | 0.0 /100 | #345 | Tragic 23.2% |
| Houma | 0.0 /100 | #346 | Tragic 21.4% |
| Yup'ik | 0.0 /100 | #347 | Tragic 19.4% |