Immigrants from France vs Panamanian Master's Degree
COMPARE
Immigrants from France
Panamanian
Master's Degree
Master's Degree Comparison
Immigrants from France
Panamanians
20.3%
MASTER'S DEGREE
100.0/ 100
METRIC RATING
23rd/ 347
METRIC RANK
14.4%
MASTER'S DEGREE
25.1/ 100
METRIC RATING
200th/ 347
METRIC RANK
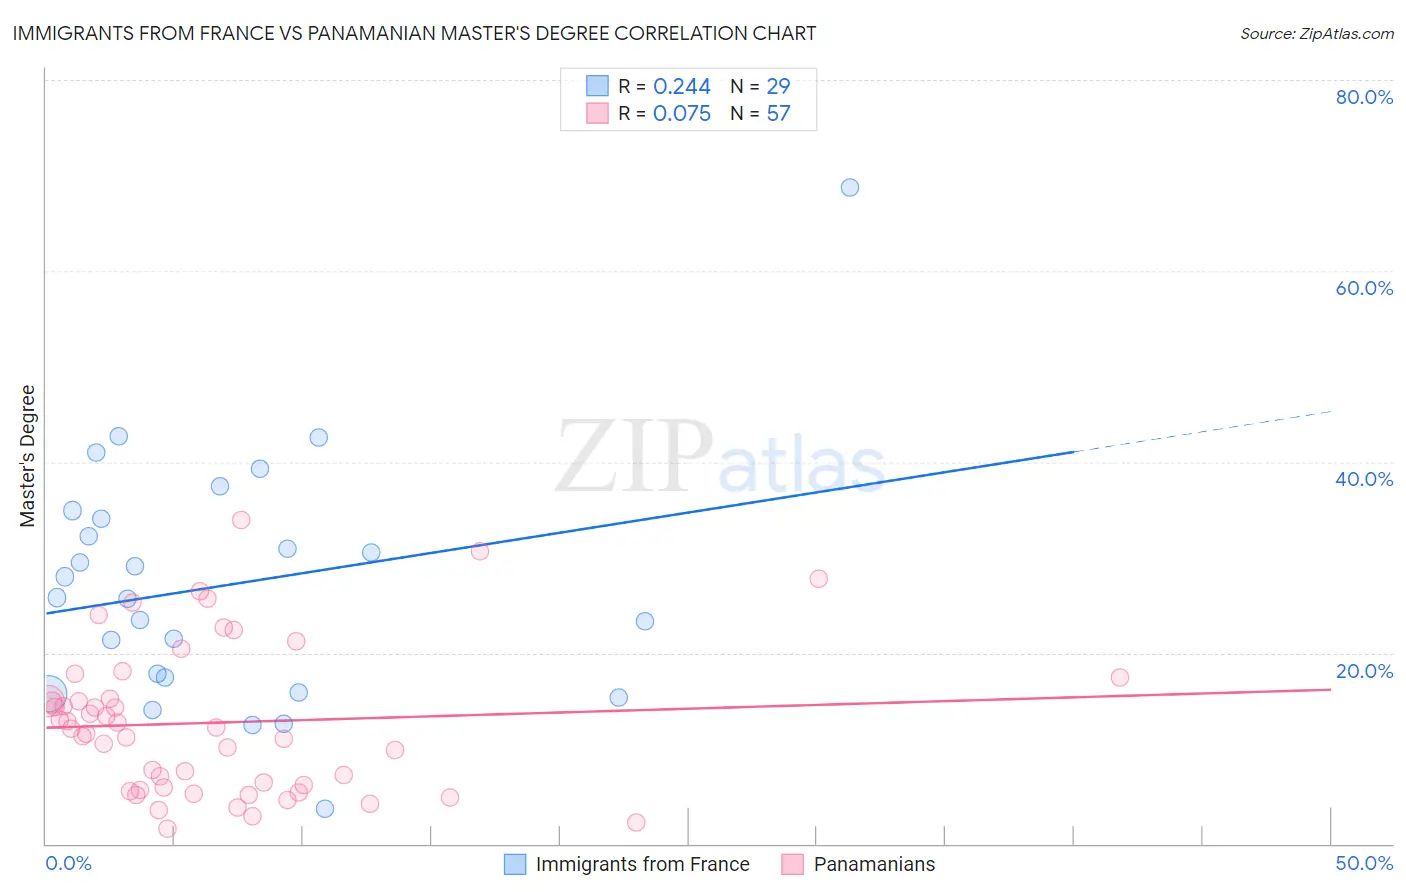
Immigrants from France vs Panamanian Master's Degree Correlation Chart
The statistical analysis conducted on geographies consisting of 287,872,995 people shows a weak positive correlation between the proportion of Immigrants from France and percentage of population with at least master's degree education in the United States with a correlation coefficient (R) of 0.244 and weighted average of 20.3%. Similarly, the statistical analysis conducted on geographies consisting of 281,151,832 people shows a slight positive correlation between the proportion of Panamanians and percentage of population with at least master's degree education in the United States with a correlation coefficient (R) of 0.075 and weighted average of 14.4%, a difference of 40.9%.
Master's Degree Correlation Summary
| Measurement | Immigrants from France | Panamanian |
| Minimum | 3.7% | 1.6% |
| Maximum | 68.8% | 33.9% |
| Range | 65.0% | 32.3% |
| Mean | 27.1% | 12.7% |
| Median | 25.8% | 12.1% |
| Interquartile 25% (IQ1) | 16.6% | 5.7% |
| Interquartile 75% (IQ3) | 34.4% | 16.3% |
| Interquartile Range (IQR) | 17.8% | 10.5% |
| Standard Deviation (Sample) | 12.9% | 7.8% |
| Standard Deviation (Population) | 12.7% | 7.7% |
Similar Demographics by Master's Degree
Demographics Similar to Immigrants from France by Master's Degree
In terms of master's degree, the demographic groups most similar to Immigrants from France are Immigrants from Sweden (20.3%, a difference of 0.070%), Israeli (20.3%, a difference of 0.28%), Immigrants from Ireland (20.4%, a difference of 0.70%), Indian (Asian) (20.5%, a difference of 0.81%), and Immigrants from Hong Kong (20.5%, a difference of 0.83%).
| Demographics | Rating | Rank | Master's Degree |
| Immigrants | Belgium | 100.0 /100 | #16 | Exceptional 20.8% |
| Immigrants | South Central Asia | 100.0 /100 | #17 | Exceptional 20.7% |
| Soviet Union | 100.0 /100 | #18 | Exceptional 20.5% |
| Immigrants | Hong Kong | 100.0 /100 | #19 | Exceptional 20.5% |
| Indians (Asian) | 100.0 /100 | #20 | Exceptional 20.5% |
| Immigrants | Ireland | 100.0 /100 | #21 | Exceptional 20.4% |
| Israelis | 100.0 /100 | #22 | Exceptional 20.3% |
| Immigrants | France | 100.0 /100 | #23 | Exceptional 20.3% |
| Immigrants | Sweden | 100.0 /100 | #24 | Exceptional 20.3% |
| Immigrants | Japan | 100.0 /100 | #25 | Exceptional 20.0% |
| Cambodians | 100.0 /100 | #26 | Exceptional 20.0% |
| Immigrants | Sri Lanka | 100.0 /100 | #27 | Exceptional 19.9% |
| Turks | 100.0 /100 | #28 | Exceptional 19.9% |
| Latvians | 100.0 /100 | #29 | Exceptional 19.8% |
| Immigrants | Turkey | 100.0 /100 | #30 | Exceptional 19.7% |
Demographics Similar to Panamanians by Master's Degree
In terms of master's degree, the demographic groups most similar to Panamanians are Scotch-Irish (14.4%, a difference of 0.010%), Immigrants from Western Africa (14.4%, a difference of 0.020%), Yugoslavian (14.4%, a difference of 0.13%), French (14.4%, a difference of 0.25%), and Trinidadian and Tobagonian (14.4%, a difference of 0.28%).
| Demographics | Rating | Rank | Master's Degree |
| Immigrants | Nigeria | 32.7 /100 | #193 | Fair 14.6% |
| Chinese | 32.5 /100 | #194 | Fair 14.6% |
| Danes | 31.3 /100 | #195 | Fair 14.5% |
| Czechoslovakians | 29.9 /100 | #196 | Fair 14.5% |
| Belgians | 28.0 /100 | #197 | Fair 14.5% |
| West Indians | 27.4 /100 | #198 | Fair 14.5% |
| Immigrants | Armenia | 27.2 /100 | #199 | Fair 14.5% |
| Panamanians | 25.1 /100 | #200 | Fair 14.4% |
| Scotch-Irish | 25.0 /100 | #201 | Fair 14.4% |
| Immigrants | Western Africa | 24.9 /100 | #202 | Fair 14.4% |
| Yugoslavians | 24.3 /100 | #203 | Fair 14.4% |
| French | 23.7 /100 | #204 | Fair 14.4% |
| Trinidadians and Tobagonians | 23.5 /100 | #205 | Fair 14.4% |
| Scandinavians | 23.3 /100 | #206 | Fair 14.4% |
| Immigrants | Bosnia and Herzegovina | 22.0 /100 | #207 | Fair 14.3% |