Hispanic or Latino vs Immigrants from Ecuador Unemployment Among Seniors over 75 years
COMPARE
Hispanic or Latino
Immigrants from Ecuador
Unemployment Among Seniors over 75 years
Unemployment Among Seniors over 75 years Comparison
Hispanics or Latinos
Immigrants from Ecuador
9.1%
UNEMPLOYMENT AMONG SENIORS OVER 75 YEARS
5.0/ 100
METRIC RATING
229th/ 347
METRIC RANK
8.5%
UNEMPLOYMENT AMONG SENIORS OVER 75 YEARS
84.6/ 100
METRIC RATING
149th/ 347
METRIC RANK
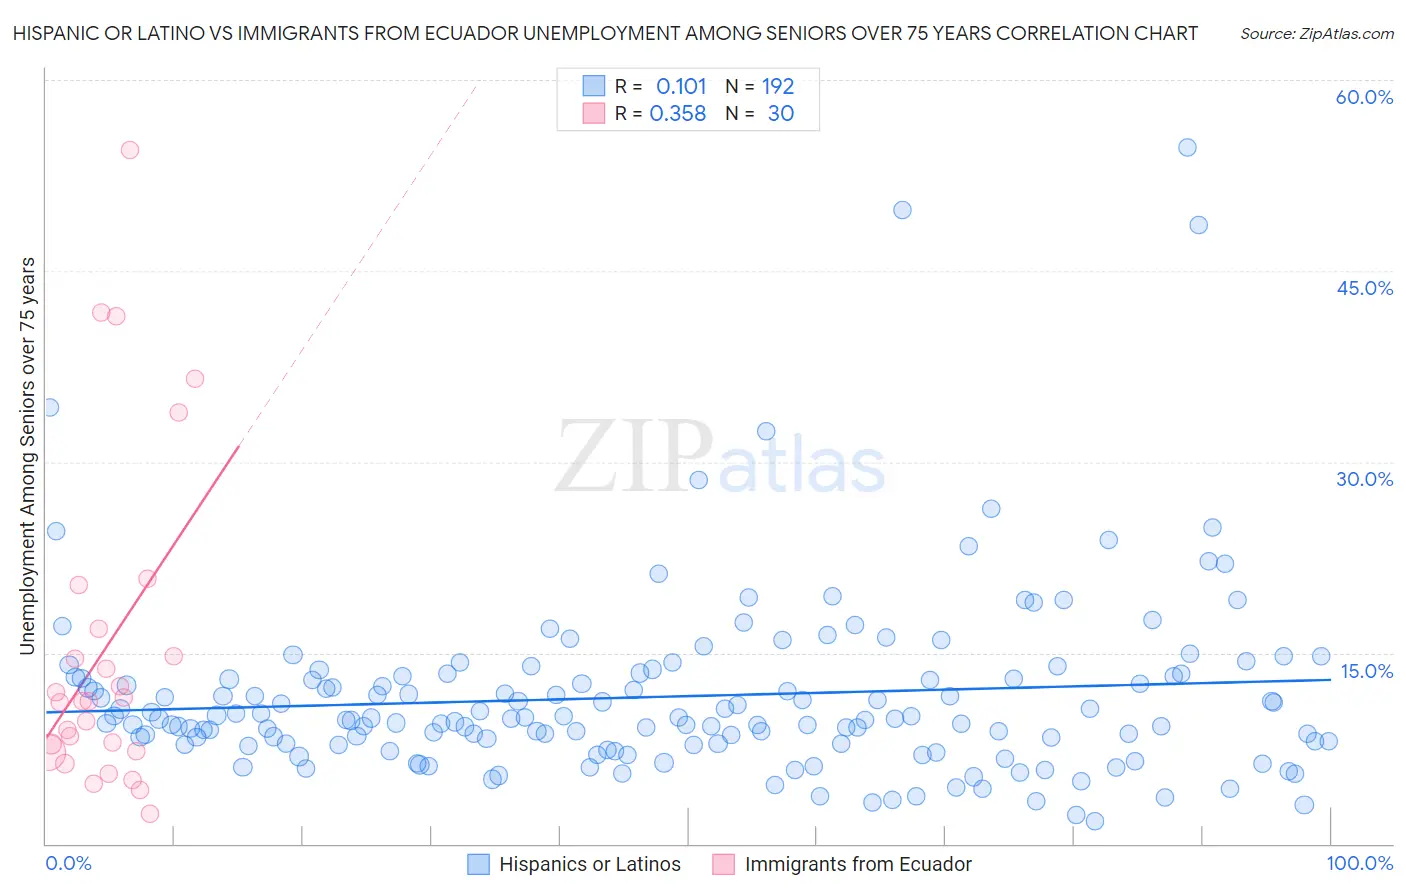
Hispanic or Latino vs Immigrants from Ecuador Unemployment Among Seniors over 75 years Correlation Chart
The statistical analysis conducted on geographies consisting of 235,499,267 people shows a poor positive correlation between the proportion of Hispanics or Latinos and unemployment rate among seniors over the age of 75 in the United States with a correlation coefficient (R) of 0.101 and weighted average of 9.1%. Similarly, the statistical analysis conducted on geographies consisting of 159,053,879 people shows a mild positive correlation between the proportion of Immigrants from Ecuador and unemployment rate among seniors over the age of 75 in the United States with a correlation coefficient (R) of 0.358 and weighted average of 8.5%, a difference of 6.4%.
Unemployment Among Seniors over 75 years Correlation Summary
| Measurement | Hispanic or Latino | Immigrants from Ecuador |
| Minimum | 1.8% | 2.4% |
| Maximum | 54.7% | 54.5% |
| Range | 52.9% | 52.1% |
| Mean | 11.6% | 15.5% |
| Median | 9.8% | 11.2% |
| Interquartile 25% (IQ1) | 7.8% | 7.3% |
| Interquartile 75% (IQ3) | 13.1% | 16.9% |
| Interquartile Range (IQR) | 5.3% | 9.6% |
| Standard Deviation (Sample) | 7.2% | 13.0% |
| Standard Deviation (Population) | 7.2% | 12.8% |
Similar Demographics by Unemployment Among Seniors over 75 years
Demographics Similar to Hispanics or Latinos by Unemployment Among Seniors over 75 years
In terms of unemployment among seniors over 75 years, the demographic groups most similar to Hispanics or Latinos are Northern European (9.1%, a difference of 0.010%), Immigrants from Central America (9.1%, a difference of 0.010%), African (9.1%, a difference of 0.030%), Yugoslavian (9.1%, a difference of 0.050%), and Vietnamese (9.1%, a difference of 0.10%).
| Demographics | Rating | Rank | Unemployment Among Seniors over 75 years |
| Peruvians | 7.3 /100 | #222 | Tragic 9.0% |
| Immigrants | Jordan | 6.9 /100 | #223 | Tragic 9.0% |
| Costa Ricans | 6.3 /100 | #224 | Tragic 9.1% |
| Navajo | 6.1 /100 | #225 | Tragic 9.1% |
| Immigrants | Bangladesh | 5.9 /100 | #226 | Tragic 9.1% |
| Samoans | 5.7 /100 | #227 | Tragic 9.1% |
| Kenyans | 5.4 /100 | #228 | Tragic 9.1% |
| Hispanics or Latinos | 5.0 /100 | #229 | Tragic 9.1% |
| Northern Europeans | 4.9 /100 | #230 | Tragic 9.1% |
| Immigrants | Central America | 4.9 /100 | #231 | Tragic 9.1% |
| Africans | 4.9 /100 | #232 | Tragic 9.1% |
| Yugoslavians | 4.8 /100 | #233 | Tragic 9.1% |
| Vietnamese | 4.6 /100 | #234 | Tragic 9.1% |
| Panamanians | 4.0 /100 | #235 | Tragic 9.1% |
| Jordanians | 4.0 /100 | #236 | Tragic 9.1% |
Demographics Similar to Immigrants from Ecuador by Unemployment Among Seniors over 75 years
In terms of unemployment among seniors over 75 years, the demographic groups most similar to Immigrants from Ecuador are Immigrants from Sierra Leone (8.5%, a difference of 0.11%), Immigrants from Colombia (8.5%, a difference of 0.11%), Immigrants from South Eastern Asia (8.5%, a difference of 0.13%), Immigrants from Romania (8.5%, a difference of 0.18%), and Paiute (8.6%, a difference of 0.21%).
| Demographics | Rating | Rank | Unemployment Among Seniors over 75 years |
| Immigrants | Ukraine | 87.0 /100 | #142 | Excellent 8.5% |
| Immigrants | Costa Rica | 86.8 /100 | #143 | Excellent 8.5% |
| Colombians | 86.7 /100 | #144 | Excellent 8.5% |
| Immigrants | Romania | 86.2 /100 | #145 | Excellent 8.5% |
| Immigrants | South Eastern Asia | 85.8 /100 | #146 | Excellent 8.5% |
| Immigrants | Sierra Leone | 85.6 /100 | #147 | Excellent 8.5% |
| Immigrants | Colombia | 85.6 /100 | #148 | Excellent 8.5% |
| Immigrants | Ecuador | 84.6 /100 | #149 | Excellent 8.5% |
| Paiute | 82.5 /100 | #150 | Excellent 8.6% |
| Immigrants | Bosnia and Herzegovina | 80.6 /100 | #151 | Excellent 8.6% |
| Latvians | 80.5 /100 | #152 | Excellent 8.6% |
| Mongolians | 80.1 /100 | #153 | Excellent 8.6% |
| Immigrants | Pakistan | 79.7 /100 | #154 | Good 8.6% |
| Ecuadorians | 78.5 /100 | #155 | Good 8.6% |
| Immigrants | Bahamas | 76.5 /100 | #156 | Good 8.6% |