Hispanic or Latino vs Nicaraguan Associate's Degree
COMPARE
Hispanic or Latino
Nicaraguan
Associate's Degree
Associate's Degree Comparison
Hispanics or Latinos
Nicaraguans
37.7%
ASSOCIATE'S DEGREE
0.0/ 100
METRIC RATING
313th/ 347
METRIC RANK
41.5%
ASSOCIATE'S DEGREE
0.4/ 100
METRIC RATING
261st/ 347
METRIC RANK
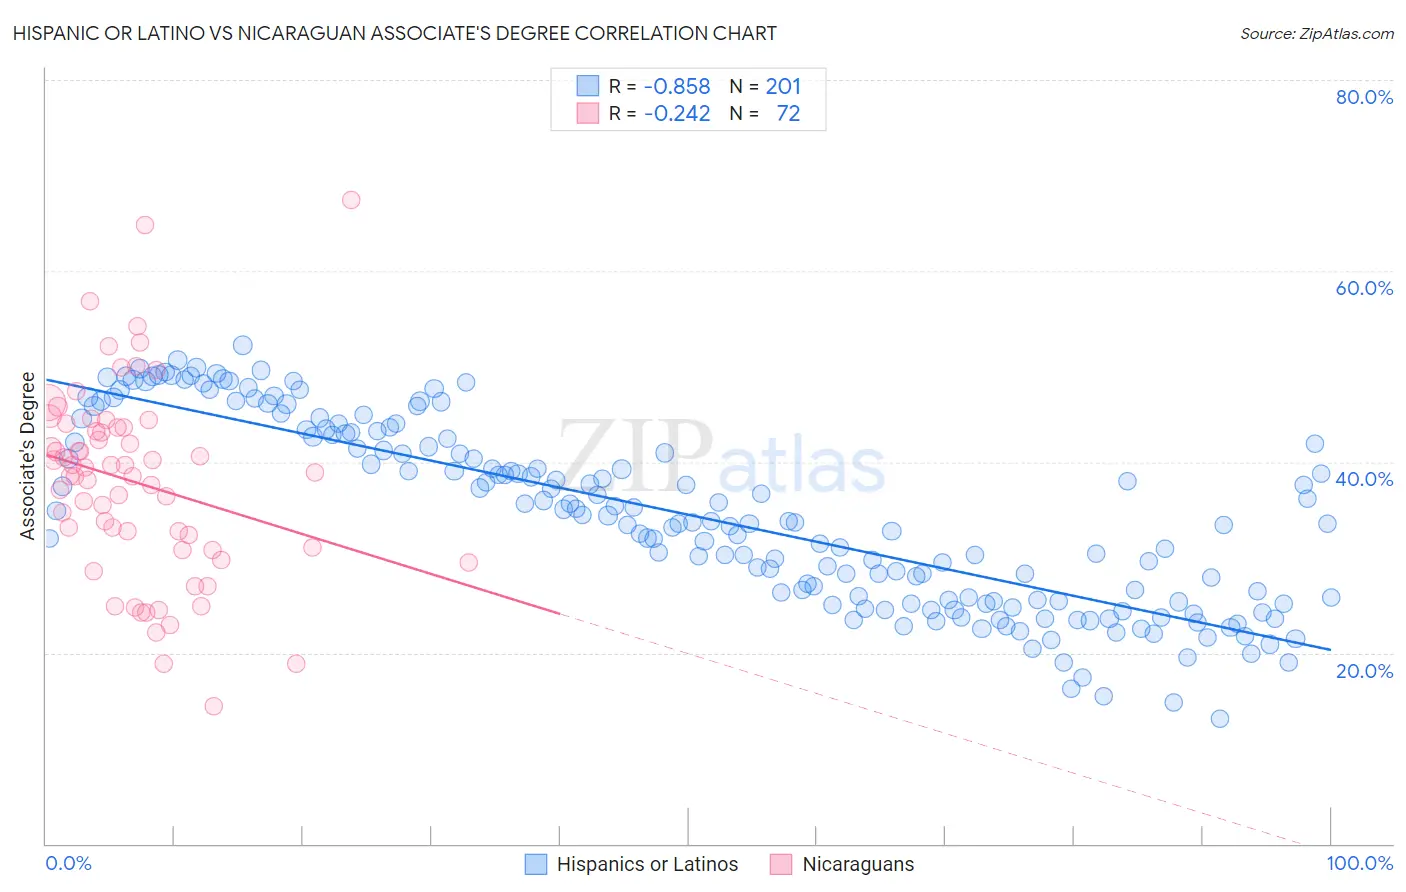
Hispanic or Latino vs Nicaraguan Associate's Degree Correlation Chart
The statistical analysis conducted on geographies consisting of 578,463,109 people shows a very strong negative correlation between the proportion of Hispanics or Latinos and percentage of population with at least associate's degree education in the United States with a correlation coefficient (R) of -0.858 and weighted average of 37.7%. Similarly, the statistical analysis conducted on geographies consisting of 285,707,386 people shows a weak negative correlation between the proportion of Nicaraguans and percentage of population with at least associate's degree education in the United States with a correlation coefficient (R) of -0.242 and weighted average of 41.5%, a difference of 10.0%.
Associate's Degree Correlation Summary
| Measurement | Hispanic or Latino | Nicaraguan |
| Minimum | 13.1% | 14.4% |
| Maximum | 52.2% | 67.4% |
| Range | 39.2% | 53.0% |
| Mean | 34.4% | 37.8% |
| Median | 33.7% | 38.7% |
| Interquartile 25% (IQ1) | 25.5% | 30.9% |
| Interquartile 75% (IQ3) | 42.9% | 43.6% |
| Interquartile Range (IQR) | 17.5% | 12.7% |
| Standard Deviation (Sample) | 9.6% | 10.2% |
| Standard Deviation (Population) | 9.6% | 10.1% |
Similar Demographics by Associate's Degree
Demographics Similar to Hispanics or Latinos by Associate's Degree
In terms of associate's degree, the demographic groups most similar to Hispanics or Latinos are Seminole (37.7%, a difference of 0.050%), Choctaw (37.8%, a difference of 0.15%), Immigrants from Latin America (37.9%, a difference of 0.37%), Creek (37.6%, a difference of 0.44%), and Crow (37.6%, a difference of 0.45%).
| Demographics | Rating | Rank | Associate's Degree |
| Shoshone | 0.0 /100 | #306 | Tragic 38.4% |
| Immigrants | El Salvador | 0.0 /100 | #307 | Tragic 38.4% |
| Mexican American Indians | 0.0 /100 | #308 | Tragic 38.2% |
| Immigrants | Guatemala | 0.0 /100 | #309 | Tragic 38.1% |
| Immigrants | Dominican Republic | 0.0 /100 | #310 | Tragic 37.9% |
| Immigrants | Latin America | 0.0 /100 | #311 | Tragic 37.9% |
| Choctaw | 0.0 /100 | #312 | Tragic 37.8% |
| Hispanics or Latinos | 0.0 /100 | #313 | Tragic 37.7% |
| Seminole | 0.0 /100 | #314 | Tragic 37.7% |
| Creek | 0.0 /100 | #315 | Tragic 37.6% |
| Crow | 0.0 /100 | #316 | Tragic 37.6% |
| Yaqui | 0.0 /100 | #317 | Tragic 37.6% |
| Alaska Natives | 0.0 /100 | #318 | Tragic 37.5% |
| Fijians | 0.0 /100 | #319 | Tragic 37.4% |
| Cajuns | 0.0 /100 | #320 | Tragic 37.4% |
Demographics Similar to Nicaraguans by Associate's Degree
In terms of associate's degree, the demographic groups most similar to Nicaraguans are Bahamian (41.5%, a difference of 0.090%), Immigrants from Jamaica (41.5%, a difference of 0.11%), Osage (41.5%, a difference of 0.12%), Marshallese (41.6%, a difference of 0.13%), and Malaysian (41.6%, a difference of 0.32%).
| Demographics | Rating | Rank | Associate's Degree |
| Cubans | 0.6 /100 | #254 | Tragic 41.9% |
| Immigrants | Guyana | 0.5 /100 | #255 | Tragic 41.8% |
| Immigrants | Congo | 0.5 /100 | #256 | Tragic 41.8% |
| Spanish Americans | 0.5 /100 | #257 | Tragic 41.8% |
| Japanese | 0.5 /100 | #258 | Tragic 41.7% |
| Malaysians | 0.4 /100 | #259 | Tragic 41.6% |
| Marshallese | 0.4 /100 | #260 | Tragic 41.6% |
| Nicaraguans | 0.4 /100 | #261 | Tragic 41.5% |
| Bahamians | 0.4 /100 | #262 | Tragic 41.5% |
| Immigrants | Jamaica | 0.3 /100 | #263 | Tragic 41.5% |
| Osage | 0.3 /100 | #264 | Tragic 41.5% |
| Africans | 0.2 /100 | #265 | Tragic 41.1% |
| Samoans | 0.2 /100 | #266 | Tragic 41.1% |
| Hawaiians | 0.2 /100 | #267 | Tragic 40.9% |
| Central American Indians | 0.2 /100 | #268 | Tragic 40.8% |