Hawaiian vs Immigrants from China 5th Grade
COMPARE
Hawaiian
Immigrants from China
5th Grade
5th Grade Comparison
Hawaiians
Immigrants from China
97.2%
5TH GRADE
25.6/ 100
METRIC RATING
196th/ 347
METRIC RANK
96.8%
5TH GRADE
0.5/ 100
METRIC RATING
259th/ 347
METRIC RANK
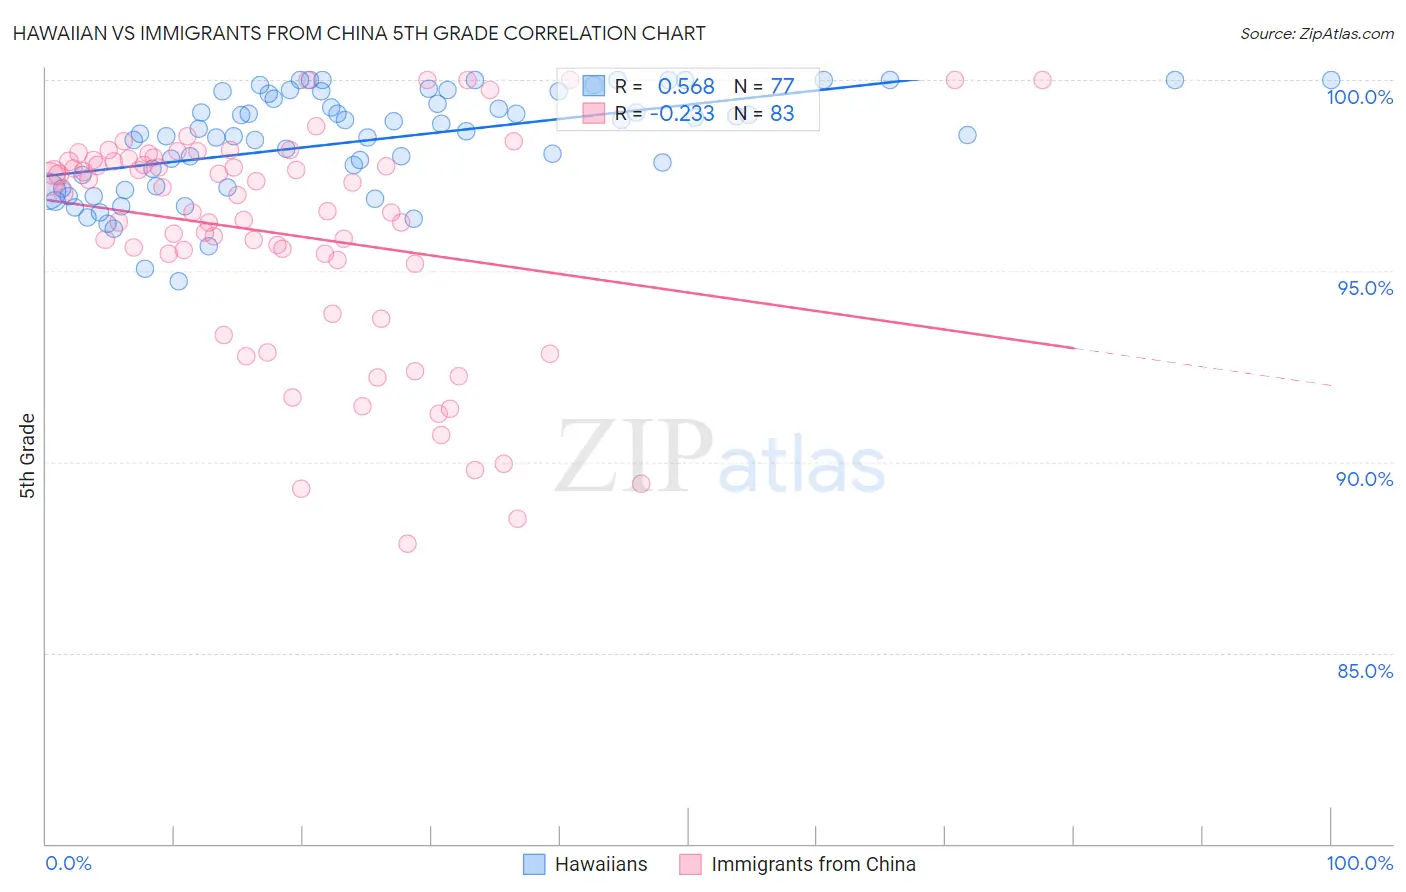
Hawaiian vs Immigrants from China 5th Grade Correlation Chart
The statistical analysis conducted on geographies consisting of 327,621,279 people shows a substantial positive correlation between the proportion of Hawaiians and percentage of population with at least 5th grade education in the United States with a correlation coefficient (R) of 0.568 and weighted average of 97.2%. Similarly, the statistical analysis conducted on geographies consisting of 457,082,957 people shows a weak negative correlation between the proportion of Immigrants from China and percentage of population with at least 5th grade education in the United States with a correlation coefficient (R) of -0.233 and weighted average of 96.8%, a difference of 0.45%.
5th Grade Correlation Summary
| Measurement | Hawaiian | Immigrants from China |
| Minimum | 94.7% | 87.9% |
| Maximum | 100.0% | 100.0% |
| Range | 5.3% | 12.1% |
| Mean | 98.4% | 96.0% |
| Median | 98.7% | 97.0% |
| Interquartile 25% (IQ1) | 97.2% | 95.2% |
| Interquartile 75% (IQ3) | 99.7% | 97.9% |
| Interquartile Range (IQR) | 2.5% | 2.7% |
| Standard Deviation (Sample) | 1.3% | 3.0% |
| Standard Deviation (Population) | 1.3% | 2.9% |
Similar Demographics by 5th Grade
Demographics Similar to Hawaiians by 5th Grade
In terms of 5th grade, the demographic groups most similar to Hawaiians are Brazilian (97.2%, a difference of 0.0%), Guamanian/Chamorro (97.2%, a difference of 0.010%), Navajo (97.2%, a difference of 0.020%), Immigrants from Albania (97.2%, a difference of 0.020%), and Black/African American (97.3%, a difference of 0.030%).
| Demographics | Rating | Rank | 5th Grade |
| Immigrants | Egypt | 32.9 /100 | #189 | Fair 97.3% |
| Blacks/African Americans | 31.8 /100 | #190 | Fair 97.3% |
| Immigrants | Brazil | 31.5 /100 | #191 | Fair 97.3% |
| Panamanians | 31.3 /100 | #192 | Fair 97.3% |
| Navajo | 29.0 /100 | #193 | Fair 97.2% |
| Immigrants | Albania | 28.5 /100 | #194 | Fair 97.2% |
| Guamanians/Chamorros | 26.8 /100 | #195 | Fair 97.2% |
| Hawaiians | 25.6 /100 | #196 | Fair 97.2% |
| Brazilians | 25.4 /100 | #197 | Fair 97.2% |
| Immigrants | Uganda | 21.1 /100 | #198 | Fair 97.2% |
| Natives/Alaskans | 18.0 /100 | #199 | Poor 97.2% |
| Immigrants | Northern Africa | 16.8 /100 | #200 | Poor 97.2% |
| Immigrants | Chile | 16.6 /100 | #201 | Poor 97.2% |
| Africans | 15.3 /100 | #202 | Poor 97.2% |
| Immigrants | Bahamas | 14.9 /100 | #203 | Poor 97.2% |
Demographics Similar to Immigrants from China by 5th Grade
In terms of 5th grade, the demographic groups most similar to Immigrants from China are Immigrants from Ethiopia (96.8%, a difference of 0.0%), Immigrants from Jamaica (96.8%, a difference of 0.020%), Immigrants from Sierra Leone (96.8%, a difference of 0.020%), Immigrants from Colombia (96.8%, a difference of 0.020%), and Peruvian (96.8%, a difference of 0.030%).
| Demographics | Rating | Rank | 5th Grade |
| Jamaicans | 0.9 /100 | #252 | Tragic 96.9% |
| Immigrants | Middle Africa | 0.8 /100 | #253 | Tragic 96.8% |
| Immigrants | Senegal | 0.8 /100 | #254 | Tragic 96.8% |
| South Americans | 0.7 /100 | #255 | Tragic 96.8% |
| Immigrants | Congo | 0.7 /100 | #256 | Tragic 96.8% |
| Peruvians | 0.6 /100 | #257 | Tragic 96.8% |
| Immigrants | Ethiopia | 0.5 /100 | #258 | Tragic 96.8% |
| Immigrants | China | 0.5 /100 | #259 | Tragic 96.8% |
| Immigrants | Jamaica | 0.4 /100 | #260 | Tragic 96.8% |
| Immigrants | Sierra Leone | 0.4 /100 | #261 | Tragic 96.8% |
| Immigrants | Colombia | 0.4 /100 | #262 | Tragic 96.8% |
| Immigrants | Uzbekistan | 0.3 /100 | #263 | Tragic 96.8% |
| West Indians | 0.3 /100 | #264 | Tragic 96.8% |
| Taiwanese | 0.3 /100 | #265 | Tragic 96.7% |
| Immigrants | Nigeria | 0.3 /100 | #266 | Tragic 96.7% |