Dutch West Indian vs Immigrants from Africa 9th Grade
COMPARE
Dutch West Indian
Immigrants from Africa
9th Grade
9th Grade Comparison
Dutch West Indians
Immigrants from Africa
94.2%
9TH GRADE
2.0/ 100
METRIC RATING
244th/ 347
METRIC RANK
94.3%
9TH GRADE
3.9/ 100
METRIC RATING
232nd/ 347
METRIC RANK
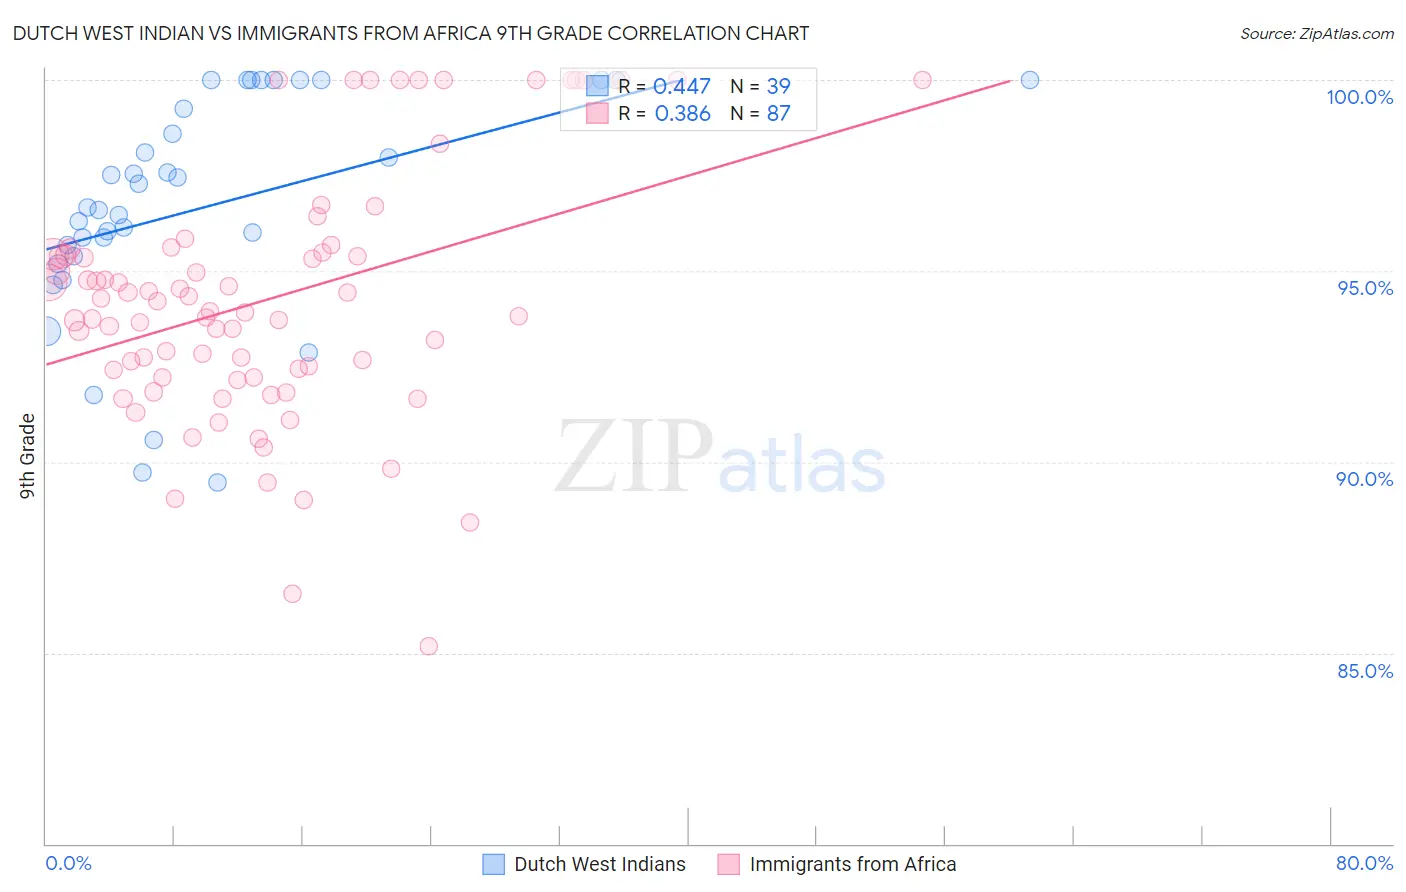
Dutch West Indian vs Immigrants from Africa 9th Grade Correlation Chart
The statistical analysis conducted on geographies consisting of 85,776,122 people shows a moderate positive correlation between the proportion of Dutch West Indians and percentage of population with at least 9th grade education in the United States with a correlation coefficient (R) of 0.447 and weighted average of 94.2%. Similarly, the statistical analysis conducted on geographies consisting of 469,381,733 people shows a mild positive correlation between the proportion of Immigrants from Africa and percentage of population with at least 9th grade education in the United States with a correlation coefficient (R) of 0.386 and weighted average of 94.3%, a difference of 0.13%.
9th Grade Correlation Summary
| Measurement | Dutch West Indian | Immigrants from Africa |
| Minimum | 89.5% | 85.2% |
| Maximum | 100.0% | 100.0% |
| Range | 10.5% | 14.8% |
| Mean | 96.7% | 94.2% |
| Median | 96.7% | 93.9% |
| Interquartile 25% (IQ1) | 95.4% | 92.2% |
| Interquartile 75% (IQ3) | 100.0% | 95.5% |
| Interquartile Range (IQR) | 4.6% | 3.3% |
| Standard Deviation (Sample) | 2.9% | 3.2% |
| Standard Deviation (Population) | 2.9% | 3.2% |
Demographics Similar to Dutch West Indians and Immigrants from Africa by 9th Grade
In terms of 9th grade, the demographic groups most similar to Dutch West Indians are Immigrants from Middle Africa (94.2%, a difference of 0.010%), Immigrants from Cameroon (94.2%, a difference of 0.010%), Paiute (94.2%, a difference of 0.010%), Senegalese (94.2%, a difference of 0.010%), and Afghan (94.2%, a difference of 0.020%). Similarly, the demographic groups most similar to Immigrants from Africa are Apache (94.3%, a difference of 0.010%), Immigrants from Panama (94.3%, a difference of 0.010%), Nigerian (94.3%, a difference of 0.010%), Costa Rican (94.3%, a difference of 0.020%), and Immigrants from Southern Europe (94.3%, a difference of 0.030%).
| Demographics | Rating | Rank | 9th Grade |
| Lumbee | 4.7 /100 | #228 | Tragic 94.4% |
| Immigrants | Southern Europe | 4.5 /100 | #229 | Tragic 94.3% |
| Apache | 4.2 /100 | #230 | Tragic 94.3% |
| Immigrants | Panama | 4.0 /100 | #231 | Tragic 94.3% |
| Immigrants | Africa | 3.9 /100 | #232 | Tragic 94.3% |
| Nigerians | 3.7 /100 | #233 | Tragic 94.3% |
| Costa Ricans | 3.5 /100 | #234 | Tragic 94.3% |
| Bolivians | 3.3 /100 | #235 | Tragic 94.3% |
| Somalis | 2.9 /100 | #236 | Tragic 94.3% |
| Koreans | 2.9 /100 | #237 | Tragic 94.3% |
| South American Indians | 2.8 /100 | #238 | Tragic 94.3% |
| Immigrants | China | 2.8 /100 | #239 | Tragic 94.3% |
| Immigrants | Ethiopia | 2.7 /100 | #240 | Tragic 94.3% |
| Spanish Americans | 2.6 /100 | #241 | Tragic 94.2% |
| Immigrants | Middle Africa | 2.2 /100 | #242 | Tragic 94.2% |
| Immigrants | Cameroon | 2.1 /100 | #243 | Tragic 94.2% |
| Dutch West Indians | 2.0 /100 | #244 | Tragic 94.2% |
| Paiute | 1.9 /100 | #245 | Tragic 94.2% |
| Senegalese | 1.9 /100 | #246 | Tragic 94.2% |
| Afghans | 1.8 /100 | #247 | Tragic 94.2% |
| Immigrants | Somalia | 1.4 /100 | #248 | Tragic 94.1% |