Haitian vs Comanche 3rd Grade
COMPARE
Haitian
Comanche
3rd Grade
3rd Grade Comparison
Haitians
Comanche
96.9%
3RD GRADE
0.0/ 100
METRIC RATING
297th/ 347
METRIC RANK
97.8%
3RD GRADE
53.8/ 100
METRIC RATING
169th/ 347
METRIC RANK
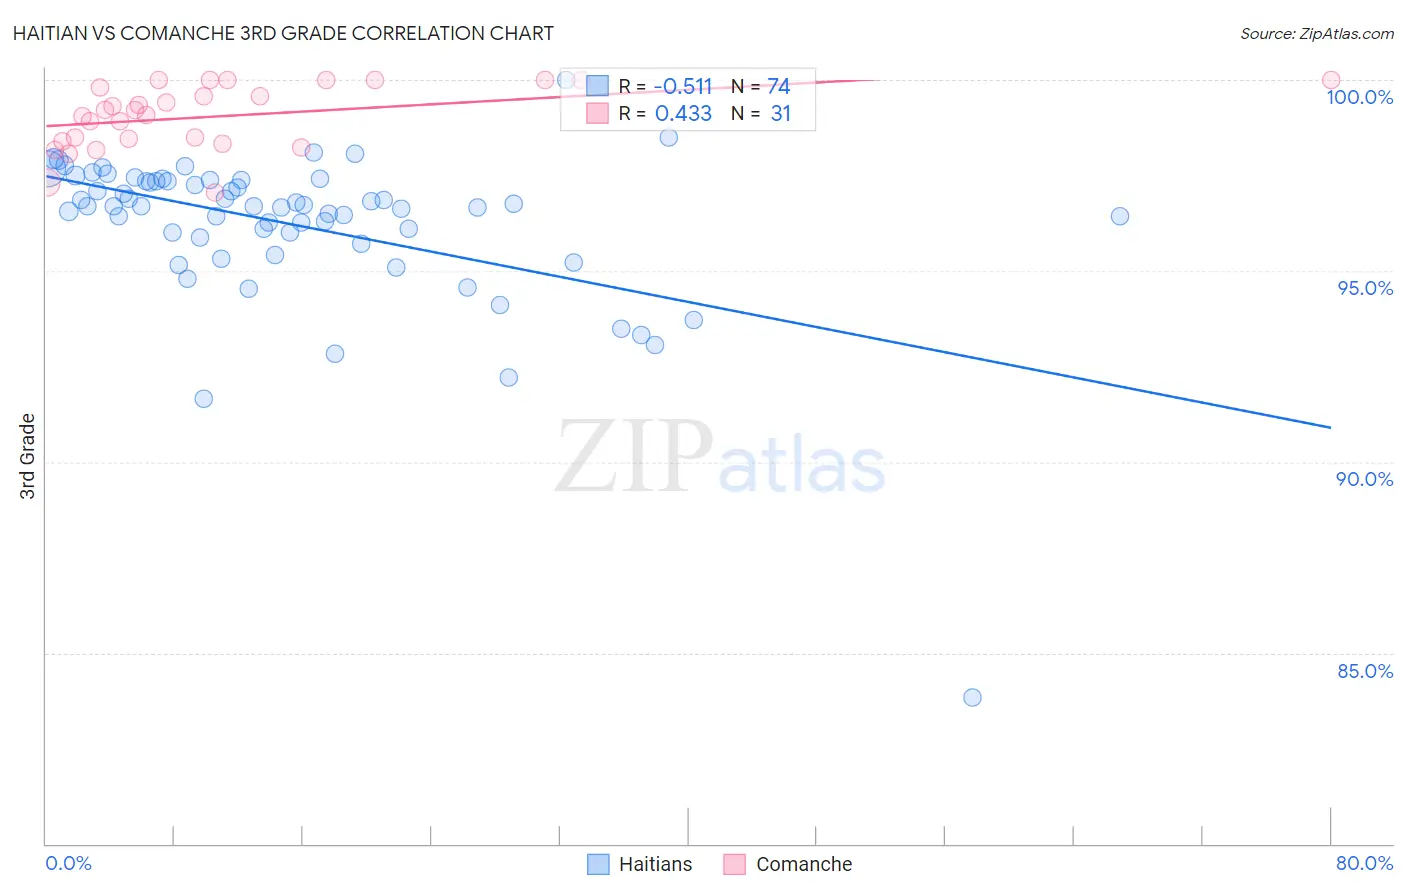
Haitian vs Comanche 3rd Grade Correlation Chart
The statistical analysis conducted on geographies consisting of 288,018,742 people shows a substantial negative correlation between the proportion of Haitians and percentage of population with at least 3rd grade education in the United States with a correlation coefficient (R) of -0.511 and weighted average of 96.9%. Similarly, the statistical analysis conducted on geographies consisting of 109,786,530 people shows a moderate positive correlation between the proportion of Comanche and percentage of population with at least 3rd grade education in the United States with a correlation coefficient (R) of 0.433 and weighted average of 97.8%, a difference of 0.95%.
3rd Grade Correlation Summary
| Measurement | Haitian | Comanche |
| Minimum | 83.8% | 97.1% |
| Maximum | 100.0% | 100.0% |
| Range | 16.2% | 2.9% |
| Mean | 96.2% | 99.1% |
| Median | 96.7% | 99.2% |
| Interquartile 25% (IQ1) | 95.9% | 98.4% |
| Interquartile 75% (IQ3) | 97.4% | 100.0% |
| Interquartile Range (IQR) | 1.5% | 1.6% |
| Standard Deviation (Sample) | 2.1% | 0.83% |
| Standard Deviation (Population) | 2.1% | 0.82% |
Similar Demographics by 3rd Grade
Demographics Similar to Haitians by 3rd Grade
In terms of 3rd grade, the demographic groups most similar to Haitians are Immigrants from Dominica (96.9%, a difference of 0.0%), Immigrants (96.9%, a difference of 0.020%), Somali (96.8%, a difference of 0.020%), Immigrants from South Eastern Asia (96.8%, a difference of 0.020%), and Immigrants from Cuba (96.8%, a difference of 0.030%).
| Demographics | Rating | Rank | 3rd Grade |
| Immigrants | Portugal | 0.0 /100 | #290 | Tragic 97.0% |
| Immigrants | Afghanistan | 0.0 /100 | #291 | Tragic 97.0% |
| British West Indians | 0.0 /100 | #292 | Tragic 97.0% |
| Immigrants | Grenada | 0.0 /100 | #293 | Tragic 97.0% |
| Malaysians | 0.0 /100 | #294 | Tragic 97.0% |
| Immigrants | Eritrea | 0.0 /100 | #295 | Tragic 97.0% |
| Immigrants | Immigrants | 0.0 /100 | #296 | Tragic 96.9% |
| Haitians | 0.0 /100 | #297 | Tragic 96.9% |
| Immigrants | Dominica | 0.0 /100 | #298 | Tragic 96.9% |
| Somalis | 0.0 /100 | #299 | Tragic 96.8% |
| Immigrants | South Eastern Asia | 0.0 /100 | #300 | Tragic 96.8% |
| Immigrants | Cuba | 0.0 /100 | #301 | Tragic 96.8% |
| Immigrants | Somalia | 0.0 /100 | #302 | Tragic 96.8% |
| Ecuadorians | 0.0 /100 | #303 | Tragic 96.7% |
| Immigrants | Caribbean | 0.0 /100 | #304 | Tragic 96.7% |
Demographics Similar to Comanche by 3rd Grade
In terms of 3rd grade, the demographic groups most similar to Comanche are Immigrants from Spain (97.8%, a difference of 0.0%), Brazilian (97.8%, a difference of 0.0%), Immigrants from Jordan (97.8%, a difference of 0.010%), Marshallese (97.8%, a difference of 0.010%), and Immigrants from Bosnia and Herzegovina (97.8%, a difference of 0.010%).
| Demographics | Rating | Rank | 3rd Grade |
| Immigrants | Jordan | 57.9 /100 | #162 | Average 97.8% |
| Marshallese | 57.2 /100 | #163 | Average 97.8% |
| Immigrants | Bosnia and Herzegovina | 56.2 /100 | #164 | Average 97.8% |
| Ugandans | 56.1 /100 | #165 | Average 97.8% |
| Dutch West Indians | 55.5 /100 | #166 | Average 97.8% |
| Chileans | 55.3 /100 | #167 | Average 97.8% |
| Immigrants | Spain | 54.3 /100 | #168 | Average 97.8% |
| Comanche | 53.8 /100 | #169 | Average 97.8% |
| Brazilians | 53.7 /100 | #170 | Average 97.8% |
| Kenyans | 51.8 /100 | #171 | Average 97.8% |
| Spanish Americans | 51.8 /100 | #172 | Average 97.8% |
| Immigrants | Korea | 50.9 /100 | #173 | Average 97.8% |
| Navajo | 50.0 /100 | #174 | Average 97.8% |
| Immigrants | Micronesia | 47.6 /100 | #175 | Average 97.8% |
| Immigrants | Poland | 47.1 /100 | #176 | Average 97.8% |