Immigrants from Ukraine vs Spanish American 9th Grade
COMPARE
Immigrants from Ukraine
Spanish American
9th Grade
9th Grade Comparison
Immigrants from Ukraine
Spanish Americans
95.0%
9TH GRADE
67.4/ 100
METRIC RATING
159th/ 347
METRIC RANK
94.2%
9TH GRADE
2.6/ 100
METRIC RATING
241st/ 347
METRIC RANK
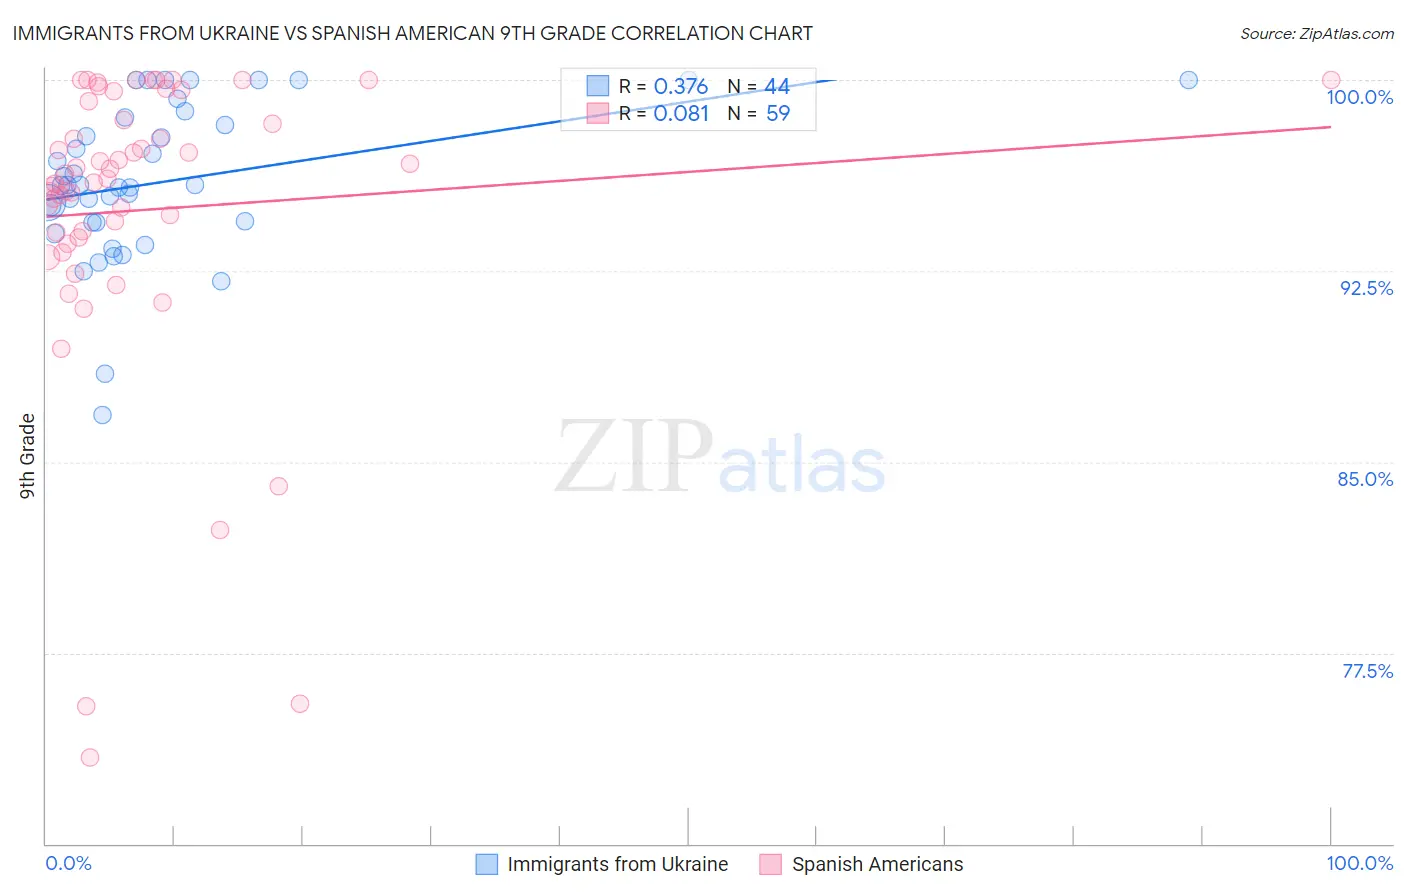
Immigrants from Ukraine vs Spanish American 9th Grade Correlation Chart
The statistical analysis conducted on geographies consisting of 289,712,791 people shows a mild positive correlation between the proportion of Immigrants from Ukraine and percentage of population with at least 9th grade education in the United States with a correlation coefficient (R) of 0.376 and weighted average of 95.0%. Similarly, the statistical analysis conducted on geographies consisting of 103,168,542 people shows a slight positive correlation between the proportion of Spanish Americans and percentage of population with at least 9th grade education in the United States with a correlation coefficient (R) of 0.081 and weighted average of 94.2%, a difference of 0.80%.
9th Grade Correlation Summary
| Measurement | Immigrants from Ukraine | Spanish American |
| Minimum | 86.8% | 73.4% |
| Maximum | 100.0% | 100.0% |
| Range | 13.2% | 26.6% |
| Mean | 96.0% | 94.9% |
| Median | 95.9% | 96.1% |
| Interquartile 25% (IQ1) | 94.4% | 93.8% |
| Interquartile 75% (IQ3) | 98.4% | 99.2% |
| Interquartile Range (IQR) | 4.0% | 5.3% |
| Standard Deviation (Sample) | 3.0% | 5.9% |
| Standard Deviation (Population) | 3.0% | 5.9% |
Similar Demographics by 9th Grade
Demographics Similar to Immigrants from Ukraine by 9th Grade
In terms of 9th grade, the demographic groups most similar to Immigrants from Ukraine are Immigrants from Italy (95.0%, a difference of 0.010%), French American Indian (95.0%, a difference of 0.010%), Bermudan (95.0%, a difference of 0.010%), Egyptian (95.0%, a difference of 0.020%), and Pakistani (95.0%, a difference of 0.030%).
| Demographics | Rating | Rank | 9th Grade |
| Ugandans | 77.0 /100 | #152 | Good 95.1% |
| Albanians | 76.1 /100 | #153 | Good 95.1% |
| Arabs | 74.9 /100 | #154 | Good 95.1% |
| Immigrants | Kazakhstan | 74.7 /100 | #155 | Good 95.1% |
| Immigrants | Kenya | 73.1 /100 | #156 | Good 95.0% |
| Mongolians | 73.0 /100 | #157 | Good 95.0% |
| Egyptians | 70.1 /100 | #158 | Good 95.0% |
| Immigrants | Ukraine | 67.4 /100 | #159 | Good 95.0% |
| Immigrants | Italy | 66.6 /100 | #160 | Good 95.0% |
| French American Indians | 66.5 /100 | #161 | Good 95.0% |
| Bermudans | 65.8 /100 | #162 | Good 95.0% |
| Pakistanis | 64.1 /100 | #163 | Good 95.0% |
| Venezuelans | 63.6 /100 | #164 | Good 95.0% |
| Blackfeet | 62.6 /100 | #165 | Good 95.0% |
| Ute | 62.6 /100 | #166 | Good 95.0% |
Demographics Similar to Spanish Americans by 9th Grade
In terms of 9th grade, the demographic groups most similar to Spanish Americans are Immigrants from Ethiopia (94.3%, a difference of 0.0%), South American Indian (94.3%, a difference of 0.010%), Immigrants from China (94.3%, a difference of 0.010%), Somali (94.3%, a difference of 0.020%), and Korean (94.3%, a difference of 0.020%).
| Demographics | Rating | Rank | 9th Grade |
| Costa Ricans | 3.5 /100 | #234 | Tragic 94.3% |
| Bolivians | 3.3 /100 | #235 | Tragic 94.3% |
| Somalis | 2.9 /100 | #236 | Tragic 94.3% |
| Koreans | 2.9 /100 | #237 | Tragic 94.3% |
| South American Indians | 2.8 /100 | #238 | Tragic 94.3% |
| Immigrants | China | 2.8 /100 | #239 | Tragic 94.3% |
| Immigrants | Ethiopia | 2.7 /100 | #240 | Tragic 94.3% |
| Spanish Americans | 2.6 /100 | #241 | Tragic 94.2% |
| Immigrants | Middle Africa | 2.2 /100 | #242 | Tragic 94.2% |
| Immigrants | Cameroon | 2.1 /100 | #243 | Tragic 94.2% |
| Dutch West Indians | 2.0 /100 | #244 | Tragic 94.2% |
| Paiute | 1.9 /100 | #245 | Tragic 94.2% |
| Senegalese | 1.9 /100 | #246 | Tragic 94.2% |
| Afghans | 1.8 /100 | #247 | Tragic 94.2% |
| Immigrants | Somalia | 1.4 /100 | #248 | Tragic 94.1% |