Basque vs Immigrants from Taiwan Doctorate Degree
COMPARE
Basque
Immigrants from Taiwan
Doctorate Degree
Doctorate Degree Comparison
Basques
Immigrants from Taiwan
1.9%
DOCTORATE DEGREE
76.9/ 100
METRIC RATING
149th/ 347
METRIC RANK
3.2%
DOCTORATE DEGREE
100.0/ 100
METRIC RATING
4th/ 347
METRIC RANK
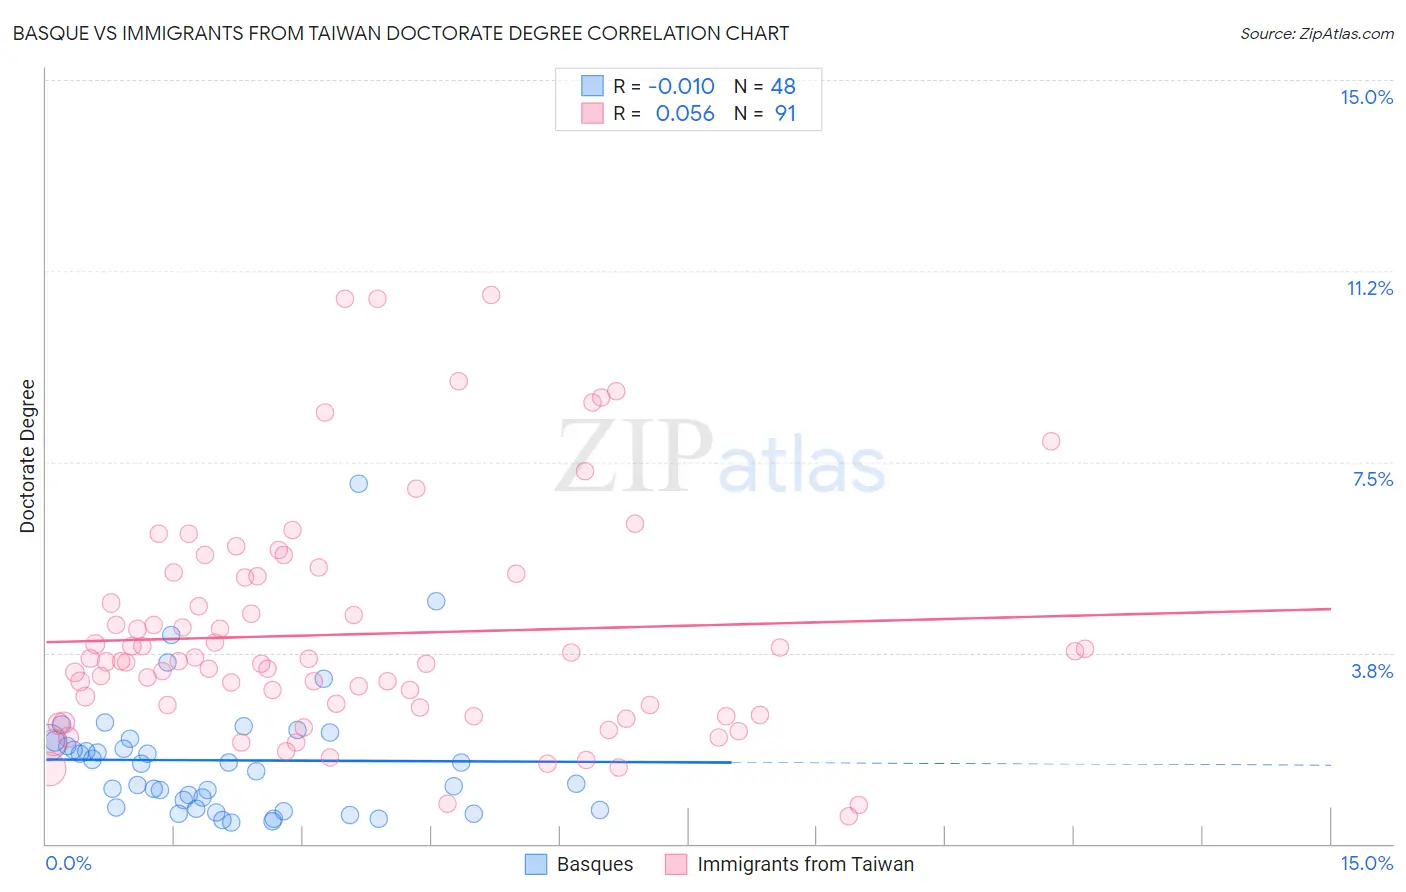
Basque vs Immigrants from Taiwan Doctorate Degree Correlation Chart
The statistical analysis conducted on geographies consisting of 165,183,356 people shows no correlation between the proportion of Basques and percentage of population with at least doctorate degree education in the United States with a correlation coefficient (R) of -0.010 and weighted average of 1.9%. Similarly, the statistical analysis conducted on geographies consisting of 297,175,735 people shows a slight positive correlation between the proportion of Immigrants from Taiwan and percentage of population with at least doctorate degree education in the United States with a correlation coefficient (R) of 0.056 and weighted average of 3.2%, a difference of 66.5%.
Doctorate Degree Correlation Summary
| Measurement | Basque | Immigrants from Taiwan |
| Minimum | 0.42% | 0.55% |
| Maximum | 7.1% | 10.8% |
| Range | 6.6% | 10.2% |
| Mean | 1.6% | 4.1% |
| Median | 1.5% | 3.6% |
| Interquartile 25% (IQ1) | 0.70% | 2.5% |
| Interquartile 75% (IQ3) | 2.0% | 5.3% |
| Interquartile Range (IQR) | 1.3% | 2.7% |
| Standard Deviation (Sample) | 1.2% | 2.2% |
| Standard Deviation (Population) | 1.2% | 2.2% |
Similar Demographics by Doctorate Degree
Demographics Similar to Basques by Doctorate Degree
In terms of doctorate degree, the demographic groups most similar to Basques are English (1.9%, a difference of 0.20%), Albanian (1.9%, a difference of 0.40%), Immigrants from Kenya (1.9%, a difference of 0.50%), Immigrants from Oceania (1.9%, a difference of 0.55%), and Immigrants from Albania (1.9%, a difference of 0.77%).
| Demographics | Rating | Rank | Doctorate Degree |
| Italians | 86.0 /100 | #142 | Excellent 2.0% |
| Sierra Leoneans | 85.1 /100 | #143 | Excellent 2.0% |
| Immigrants | Moldova | 84.3 /100 | #144 | Excellent 2.0% |
| Kenyans | 83.6 /100 | #145 | Excellent 1.9% |
| Immigrants | Syria | 83.6 /100 | #146 | Excellent 1.9% |
| Immigrants | Senegal | 82.5 /100 | #147 | Excellent 1.9% |
| Luxembourgers | 81.1 /100 | #148 | Excellent 1.9% |
| Basques | 76.9 /100 | #149 | Good 1.9% |
| English | 75.9 /100 | #150 | Good 1.9% |
| Albanians | 74.8 /100 | #151 | Good 1.9% |
| Immigrants | Kenya | 74.3 /100 | #152 | Good 1.9% |
| Immigrants | Oceania | 74.0 /100 | #153 | Good 1.9% |
| Immigrants | Albania | 72.8 /100 | #154 | Good 1.9% |
| Poles | 72.7 /100 | #155 | Good 1.9% |
| Slavs | 72.4 /100 | #156 | Good 1.9% |
Demographics Similar to Immigrants from Taiwan by Doctorate Degree
In terms of doctorate degree, the demographic groups most similar to Immigrants from Taiwan are Iranian (3.1%, a difference of 1.5%), Okinawan (3.3%, a difference of 2.6%), Immigrants from Switzerland (3.1%, a difference of 3.5%), Immigrants from China (3.1%, a difference of 3.6%), and Immigrants from Israel (3.0%, a difference of 4.9%).
| Demographics | Rating | Rank | Doctorate Degree |
| Immigrants | Singapore | 100.0 /100 | #1 | Exceptional 3.7% |
| Filipinos | 100.0 /100 | #2 | Exceptional 3.4% |
| Okinawans | 100.0 /100 | #3 | Exceptional 3.3% |
| Immigrants | Taiwan | 100.0 /100 | #4 | Exceptional 3.2% |
| Iranians | 100.0 /100 | #5 | Exceptional 3.1% |
| Immigrants | Switzerland | 100.0 /100 | #6 | Exceptional 3.1% |
| Immigrants | China | 100.0 /100 | #7 | Exceptional 3.1% |
| Immigrants | Israel | 100.0 /100 | #8 | Exceptional 3.0% |
| Immigrants | Iran | 100.0 /100 | #9 | Exceptional 3.0% |
| Immigrants | Eastern Asia | 100.0 /100 | #10 | Exceptional 3.0% |
| Indians (Asian) | 100.0 /100 | #11 | Exceptional 2.9% |
| Immigrants | Belgium | 100.0 /100 | #12 | Exceptional 2.9% |
| Immigrants | Sweden | 100.0 /100 | #13 | Exceptional 2.9% |
| Immigrants | France | 100.0 /100 | #14 | Exceptional 2.9% |
| Immigrants | India | 100.0 /100 | #15 | Exceptional 2.8% |