Ukrainian vs Immigrants from Taiwan Doctorate Degree
COMPARE
Ukrainian
Immigrants from Taiwan
Doctorate Degree
Doctorate Degree Comparison
Ukrainians
Immigrants from Taiwan
2.1%
DOCTORATE DEGREE
97.2/ 100
METRIC RATING
109th/ 347
METRIC RANK
3.2%
DOCTORATE DEGREE
100.0/ 100
METRIC RATING
4th/ 347
METRIC RANK
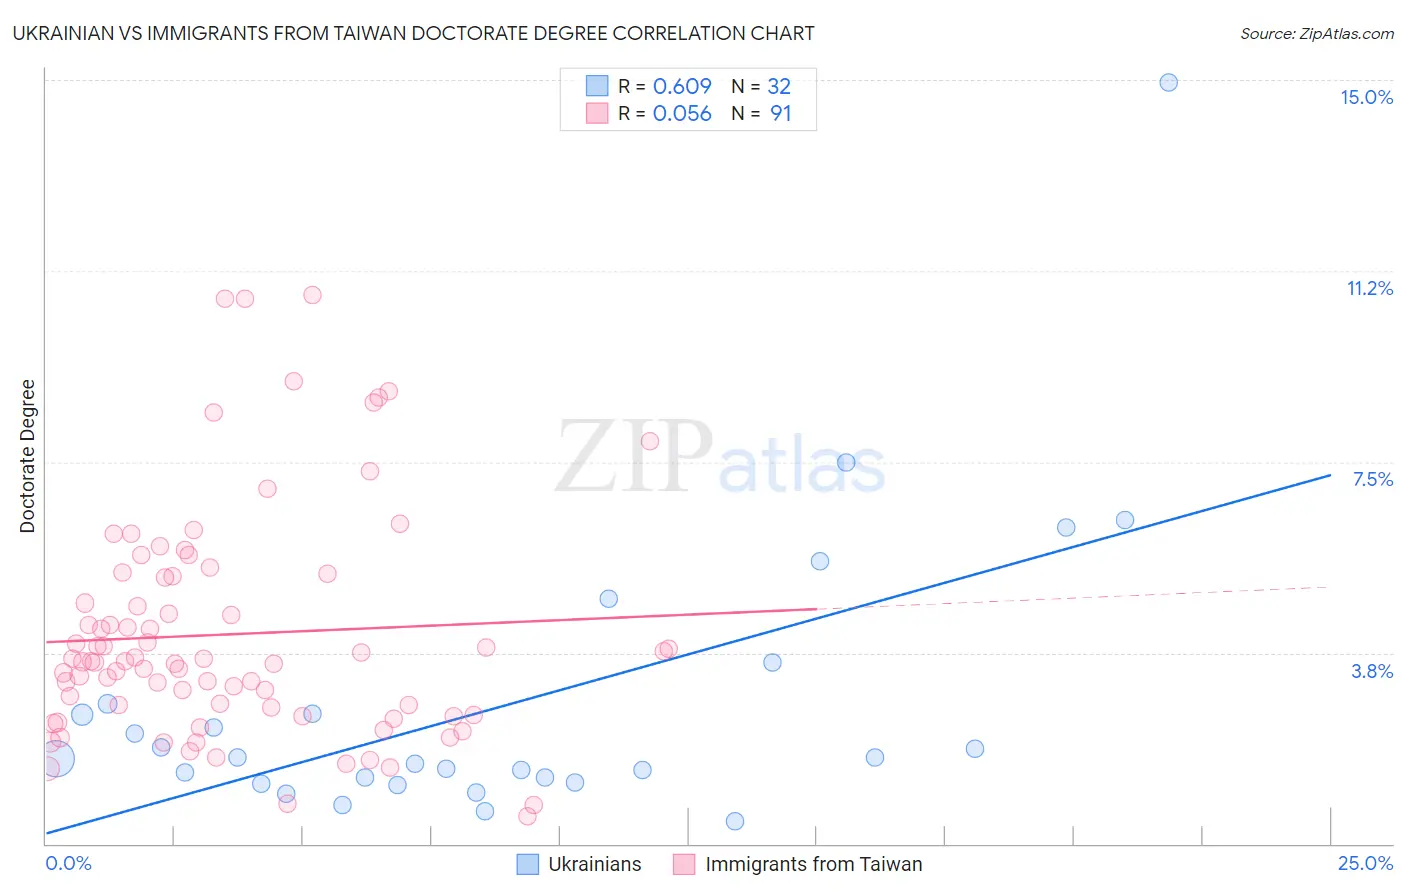
Ukrainian vs Immigrants from Taiwan Doctorate Degree Correlation Chart
The statistical analysis conducted on geographies consisting of 442,609,688 people shows a significant positive correlation between the proportion of Ukrainians and percentage of population with at least doctorate degree education in the United States with a correlation coefficient (R) of 0.609 and weighted average of 2.1%. Similarly, the statistical analysis conducted on geographies consisting of 297,175,735 people shows a slight positive correlation between the proportion of Immigrants from Taiwan and percentage of population with at least doctorate degree education in the United States with a correlation coefficient (R) of 0.056 and weighted average of 3.2%, a difference of 53.8%.
Doctorate Degree Correlation Summary
| Measurement | Ukrainian | Immigrants from Taiwan |
| Minimum | 0.44% | 0.55% |
| Maximum | 14.9% | 10.8% |
| Range | 14.5% | 10.2% |
| Mean | 2.7% | 4.1% |
| Median | 1.7% | 3.6% |
| Interquartile 25% (IQ1) | 1.2% | 2.5% |
| Interquartile 75% (IQ3) | 2.6% | 5.3% |
| Interquartile Range (IQR) | 1.4% | 2.7% |
| Standard Deviation (Sample) | 2.9% | 2.2% |
| Standard Deviation (Population) | 2.8% | 2.2% |
Similar Demographics by Doctorate Degree
Demographics Similar to Ukrainians by Doctorate Degree
In terms of doctorate degree, the demographic groups most similar to Ukrainians are Immigrants from Germany (2.1%, a difference of 0.060%), Brazilian (2.1%, a difference of 0.070%), Immigrants from Pakistan (2.1%, a difference of 0.13%), Syrian (2.1%, a difference of 0.15%), and European (2.1%, a difference of 0.28%).
| Demographics | Rating | Rank | Doctorate Degree |
| Immigrants | Chile | 98.1 /100 | #102 | Exceptional 2.1% |
| Romanians | 98.1 /100 | #103 | Exceptional 2.1% |
| Austrians | 98.0 /100 | #104 | Exceptional 2.1% |
| Arabs | 97.8 /100 | #105 | Exceptional 2.1% |
| Sudanese | 97.7 /100 | #106 | Exceptional 2.1% |
| Europeans | 97.5 /100 | #107 | Exceptional 2.1% |
| Immigrants | Germany | 97.3 /100 | #108 | Exceptional 2.1% |
| Ukrainians | 97.2 /100 | #109 | Exceptional 2.1% |
| Brazilians | 97.2 /100 | #110 | Exceptional 2.1% |
| Immigrants | Pakistan | 97.1 /100 | #111 | Exceptional 2.1% |
| Syrians | 97.1 /100 | #112 | Exceptional 2.1% |
| Immigrants | Italy | 96.9 /100 | #113 | Exceptional 2.1% |
| Immigrants | Croatia | 96.8 /100 | #114 | Exceptional 2.1% |
| Taiwanese | 96.7 /100 | #115 | Exceptional 2.1% |
| Maltese | 96.2 /100 | #116 | Exceptional 2.1% |
Demographics Similar to Immigrants from Taiwan by Doctorate Degree
In terms of doctorate degree, the demographic groups most similar to Immigrants from Taiwan are Iranian (3.1%, a difference of 1.5%), Okinawan (3.3%, a difference of 2.6%), Immigrants from Switzerland (3.1%, a difference of 3.5%), Immigrants from China (3.1%, a difference of 3.6%), and Immigrants from Israel (3.0%, a difference of 4.9%).
| Demographics | Rating | Rank | Doctorate Degree |
| Immigrants | Singapore | 100.0 /100 | #1 | Exceptional 3.7% |
| Filipinos | 100.0 /100 | #2 | Exceptional 3.4% |
| Okinawans | 100.0 /100 | #3 | Exceptional 3.3% |
| Immigrants | Taiwan | 100.0 /100 | #4 | Exceptional 3.2% |
| Iranians | 100.0 /100 | #5 | Exceptional 3.1% |
| Immigrants | Switzerland | 100.0 /100 | #6 | Exceptional 3.1% |
| Immigrants | China | 100.0 /100 | #7 | Exceptional 3.1% |
| Immigrants | Israel | 100.0 /100 | #8 | Exceptional 3.0% |
| Immigrants | Iran | 100.0 /100 | #9 | Exceptional 3.0% |
| Immigrants | Eastern Asia | 100.0 /100 | #10 | Exceptional 3.0% |
| Indians (Asian) | 100.0 /100 | #11 | Exceptional 2.9% |
| Immigrants | Belgium | 100.0 /100 | #12 | Exceptional 2.9% |
| Immigrants | Sweden | 100.0 /100 | #13 | Exceptional 2.9% |
| Immigrants | France | 100.0 /100 | #14 | Exceptional 2.9% |
| Immigrants | India | 100.0 /100 | #15 | Exceptional 2.8% |