Mongolian vs Immigrants from Taiwan Doctorate Degree
COMPARE
Mongolian
Immigrants from Taiwan
Doctorate Degree
Doctorate Degree Comparison
Mongolians
Immigrants from Taiwan
2.8%
DOCTORATE DEGREE
100.0/ 100
METRIC RATING
22nd/ 347
METRIC RANK
3.2%
DOCTORATE DEGREE
100.0/ 100
METRIC RATING
4th/ 347
METRIC RANK
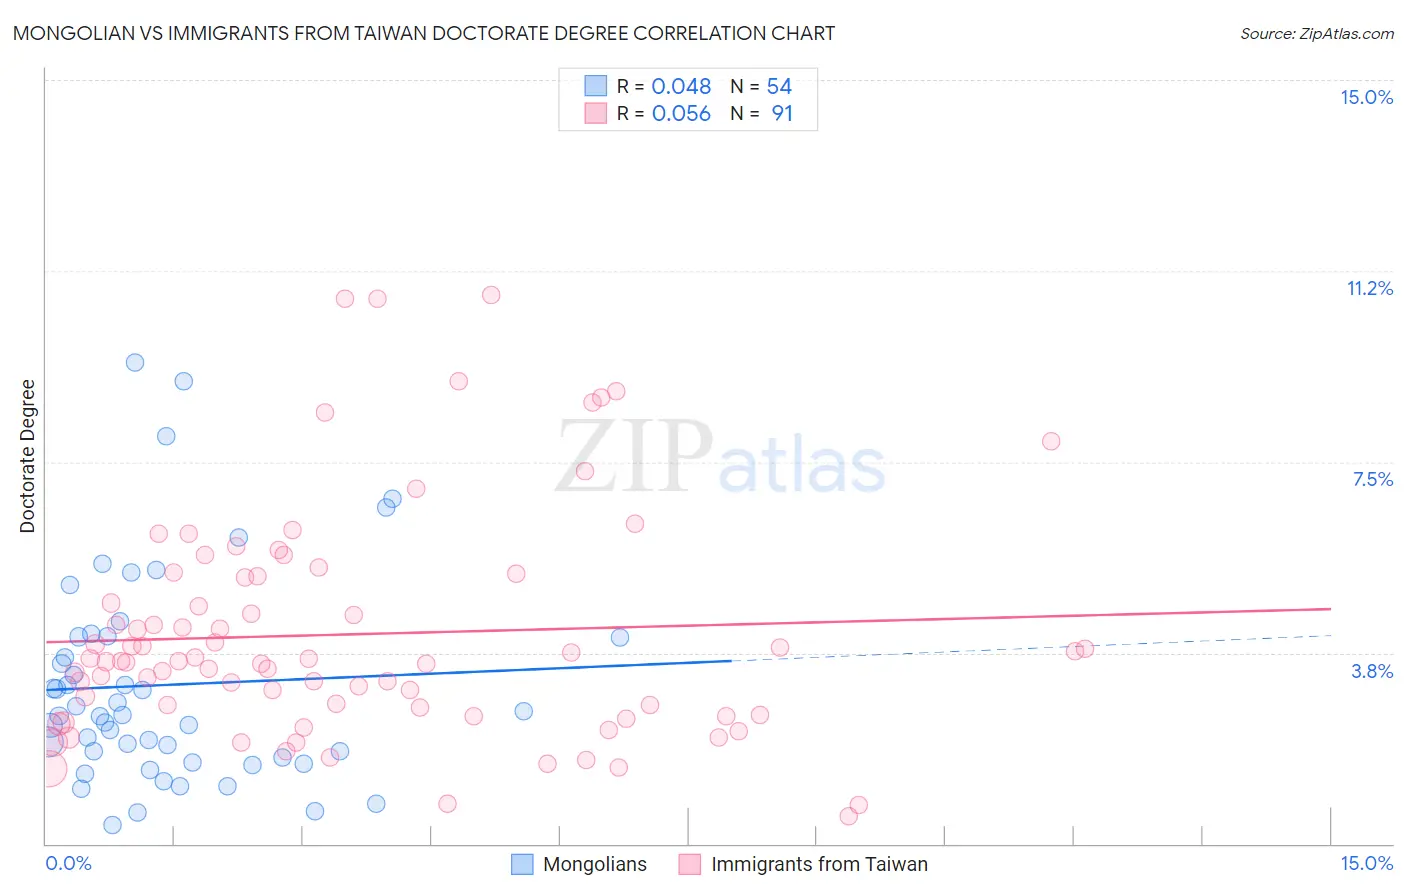
Mongolian vs Immigrants from Taiwan Doctorate Degree Correlation Chart
The statistical analysis conducted on geographies consisting of 140,132,264 people shows no correlation between the proportion of Mongolians and percentage of population with at least doctorate degree education in the United States with a correlation coefficient (R) of 0.048 and weighted average of 2.8%. Similarly, the statistical analysis conducted on geographies consisting of 297,175,735 people shows a slight positive correlation between the proportion of Immigrants from Taiwan and percentage of population with at least doctorate degree education in the United States with a correlation coefficient (R) of 0.056 and weighted average of 3.2%, a difference of 15.9%.
Doctorate Degree Correlation Summary
| Measurement | Mongolian | Immigrants from Taiwan |
| Minimum | 0.36% | 0.55% |
| Maximum | 9.5% | 10.8% |
| Range | 9.1% | 10.2% |
| Mean | 3.1% | 4.1% |
| Median | 2.5% | 3.6% |
| Interquartile 25% (IQ1) | 1.7% | 2.5% |
| Interquartile 75% (IQ3) | 4.1% | 5.3% |
| Interquartile Range (IQR) | 2.4% | 2.7% |
| Standard Deviation (Sample) | 2.1% | 2.2% |
| Standard Deviation (Population) | 2.1% | 2.2% |
Demographics Similar to Mongolians and Immigrants from Taiwan by Doctorate Degree
In terms of doctorate degree, the demographic groups most similar to Mongolians are Immigrants from Denmark (2.8%, a difference of 0.13%), Thai (2.8%, a difference of 0.20%), Immigrants from Hong Kong (2.8%, a difference of 0.55%), Immigrants from Japan (2.8%, a difference of 0.91%), and Immigrants from Sri Lanka (2.8%, a difference of 1.3%). Similarly, the demographic groups most similar to Immigrants from Taiwan are Iranian (3.1%, a difference of 1.5%), Okinawan (3.3%, a difference of 2.6%), Immigrants from Switzerland (3.1%, a difference of 3.5%), Immigrants from China (3.1%, a difference of 3.6%), and Immigrants from Israel (3.0%, a difference of 4.9%).
| Demographics | Rating | Rank | Doctorate Degree |
| Okinawans | 100.0 /100 | #3 | Exceptional 3.3% |
| Immigrants | Taiwan | 100.0 /100 | #4 | Exceptional 3.2% |
| Iranians | 100.0 /100 | #5 | Exceptional 3.1% |
| Immigrants | Switzerland | 100.0 /100 | #6 | Exceptional 3.1% |
| Immigrants | China | 100.0 /100 | #7 | Exceptional 3.1% |
| Immigrants | Israel | 100.0 /100 | #8 | Exceptional 3.0% |
| Immigrants | Iran | 100.0 /100 | #9 | Exceptional 3.0% |
| Immigrants | Eastern Asia | 100.0 /100 | #10 | Exceptional 3.0% |
| Indians (Asian) | 100.0 /100 | #11 | Exceptional 2.9% |
| Immigrants | Belgium | 100.0 /100 | #12 | Exceptional 2.9% |
| Immigrants | Sweden | 100.0 /100 | #13 | Exceptional 2.9% |
| Immigrants | France | 100.0 /100 | #14 | Exceptional 2.9% |
| Immigrants | India | 100.0 /100 | #15 | Exceptional 2.8% |
| Eastern Europeans | 100.0 /100 | #16 | Exceptional 2.8% |
| Immigrants | Australia | 100.0 /100 | #17 | Exceptional 2.8% |
| Immigrants | Sri Lanka | 100.0 /100 | #18 | Exceptional 2.8% |
| Immigrants | Japan | 100.0 /100 | #19 | Exceptional 2.8% |
| Immigrants | Hong Kong | 100.0 /100 | #20 | Exceptional 2.8% |
| Thais | 100.0 /100 | #21 | Exceptional 2.8% |
| Mongolians | 100.0 /100 | #22 | Exceptional 2.8% |
| Immigrants | Denmark | 100.0 /100 | #23 | Exceptional 2.8% |