Guatemalan vs Immigrants from Korea 11th Grade
COMPARE
Guatemalan
Immigrants from Korea
11th Grade
11th Grade Comparison
Guatemalans
Immigrants from Korea
86.4%
11TH GRADE
0.0/ 100
METRIC RATING
339th/ 347
METRIC RANK
93.3%
11TH GRADE
97.0/ 100
METRIC RATING
118th/ 347
METRIC RANK
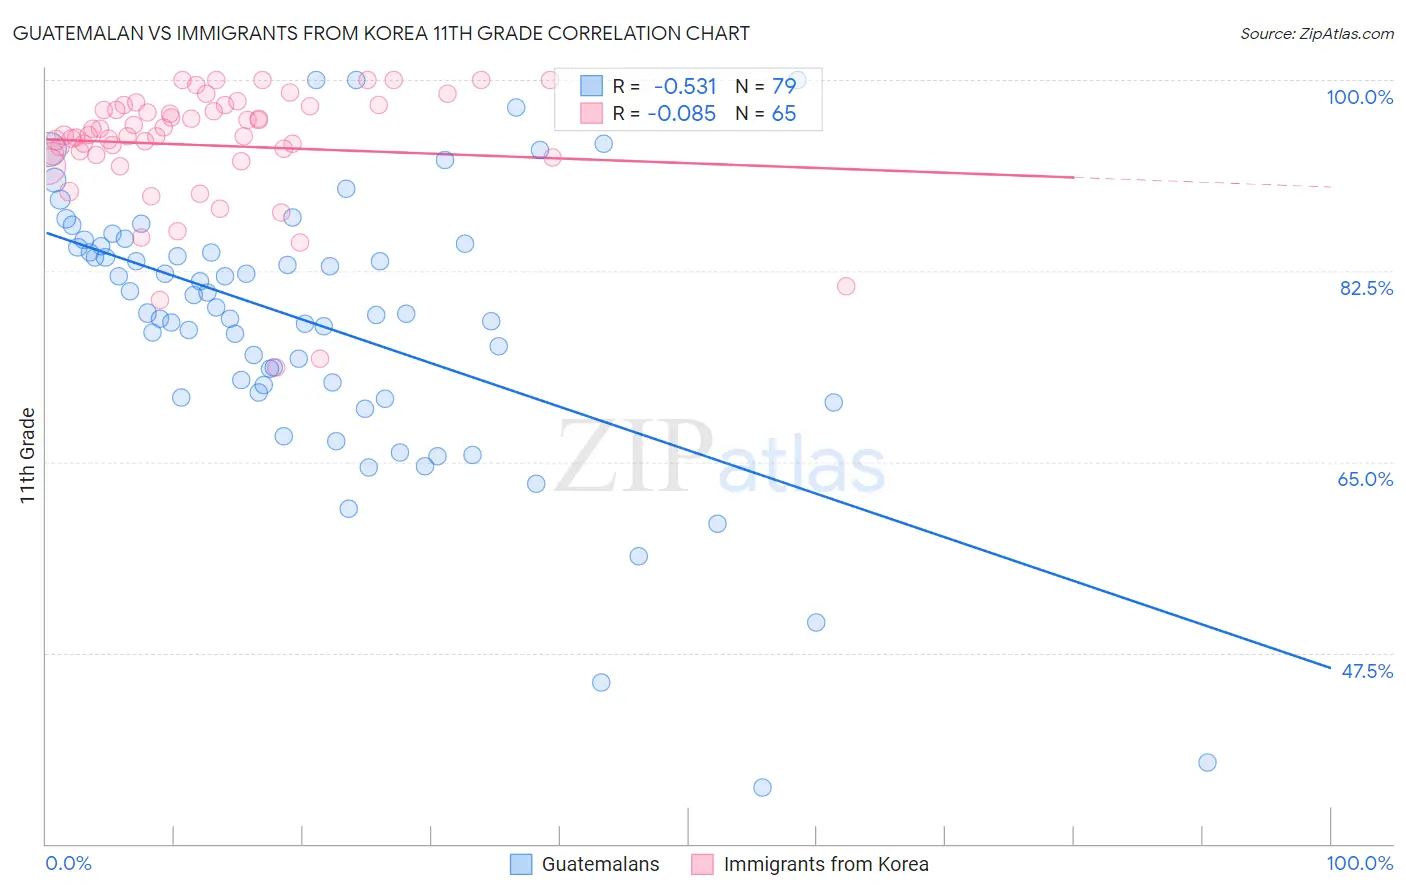
Guatemalan vs Immigrants from Korea 11th Grade Correlation Chart
The statistical analysis conducted on geographies consisting of 409,566,618 people shows a substantial negative correlation between the proportion of Guatemalans and percentage of population with at least 11th grade education in the United States with a correlation coefficient (R) of -0.531 and weighted average of 86.4%. Similarly, the statistical analysis conducted on geographies consisting of 416,280,217 people shows a slight negative correlation between the proportion of Immigrants from Korea and percentage of population with at least 11th grade education in the United States with a correlation coefficient (R) of -0.085 and weighted average of 93.3%, a difference of 8.0%.
11th Grade Correlation Summary
| Measurement | Guatemalan | Immigrants from Korea |
| Minimum | 35.2% | 73.6% |
| Maximum | 100.0% | 100.0% |
| Range | 64.8% | 26.4% |
| Mean | 77.6% | 94.0% |
| Median | 78.6% | 94.9% |
| Interquartile 25% (IQ1) | 71.4% | 93.0% |
| Interquartile 75% (IQ3) | 84.8% | 97.6% |
| Interquartile Range (IQR) | 13.4% | 4.6% |
| Standard Deviation (Sample) | 12.6% | 5.7% |
| Standard Deviation (Population) | 12.5% | 5.6% |
Similar Demographics by 11th Grade
Demographics Similar to Guatemalans by 11th Grade
In terms of 11th grade, the demographic groups most similar to Guatemalans are Salvadoran (86.2%, a difference of 0.23%), Mexican (86.1%, a difference of 0.29%), Immigrants from Latin America (86.8%, a difference of 0.49%), Immigrants from Honduras (86.9%, a difference of 0.61%), and Immigrants from Dominican Republic (86.9%, a difference of 0.62%).
| Demographics | Rating | Rank | 11th Grade |
| Immigrants | Azores | 0.0 /100 | #332 | Tragic 87.2% |
| Immigrants | Yemen | 0.0 /100 | #333 | Tragic 87.1% |
| Houma | 0.0 /100 | #334 | Tragic 87.0% |
| Central Americans | 0.0 /100 | #335 | Tragic 86.9% |
| Immigrants | Dominican Republic | 0.0 /100 | #336 | Tragic 86.9% |
| Immigrants | Honduras | 0.0 /100 | #337 | Tragic 86.9% |
| Immigrants | Latin America | 0.0 /100 | #338 | Tragic 86.8% |
| Guatemalans | 0.0 /100 | #339 | Tragic 86.4% |
| Salvadorans | 0.0 /100 | #340 | Tragic 86.2% |
| Mexicans | 0.0 /100 | #341 | Tragic 86.1% |
| Immigrants | Guatemala | 0.0 /100 | #342 | Tragic 85.8% |
| Immigrants | El Salvador | 0.0 /100 | #343 | Tragic 85.3% |
| Yakama | 0.0 /100 | #344 | Tragic 85.0% |
| Immigrants | Central America | 0.0 /100 | #345 | Tragic 84.9% |
| Spanish American Indians | 0.0 /100 | #346 | Tragic 84.7% |
Demographics Similar to Immigrants from Korea by 11th Grade
In terms of 11th grade, the demographic groups most similar to Immigrants from Korea are Israeli (93.3%, a difference of 0.0%), Immigrants from Russia (93.3%, a difference of 0.030%), White/Caucasian (93.3%, a difference of 0.040%), Immigrants from Hungary (93.4%, a difference of 0.050%), and German Russian (93.3%, a difference of 0.050%).
| Demographics | Rating | Rank | 11th Grade |
| Yugoslavians | 98.1 /100 | #111 | Exceptional 93.4% |
| Immigrants | Germany | 98.0 /100 | #112 | Exceptional 93.4% |
| Immigrants | Zimbabwe | 97.8 /100 | #113 | Exceptional 93.4% |
| Jordanians | 97.8 /100 | #114 | Exceptional 93.4% |
| Palestinians | 97.7 /100 | #115 | Exceptional 93.4% |
| Immigrants | Hungary | 97.5 /100 | #116 | Exceptional 93.4% |
| Whites/Caucasians | 97.4 /100 | #117 | Exceptional 93.3% |
| Immigrants | Korea | 97.0 /100 | #118 | Exceptional 93.3% |
| Israelis | 97.0 /100 | #119 | Exceptional 93.3% |
| Immigrants | Russia | 96.6 /100 | #120 | Exceptional 93.3% |
| German Russians | 96.4 /100 | #121 | Exceptional 93.3% |
| Immigrants | Belarus | 96.3 /100 | #122 | Exceptional 93.3% |
| Immigrants | Greece | 95.9 /100 | #123 | Exceptional 93.2% |
| Immigrants | Eastern Europe | 95.9 /100 | #124 | Exceptional 93.2% |
| Immigrants | Sri Lanka | 95.6 /100 | #125 | Exceptional 93.2% |