Guatemalan vs Immigrants from Israel 11th Grade
COMPARE
Guatemalan
Immigrants from Israel
11th Grade
11th Grade Comparison
Guatemalans
Immigrants from Israel
86.4%
11TH GRADE
0.0/ 100
METRIC RATING
339th/ 347
METRIC RANK
93.5%
11TH GRADE
98.8/ 100
METRIC RATING
98th/ 347
METRIC RANK
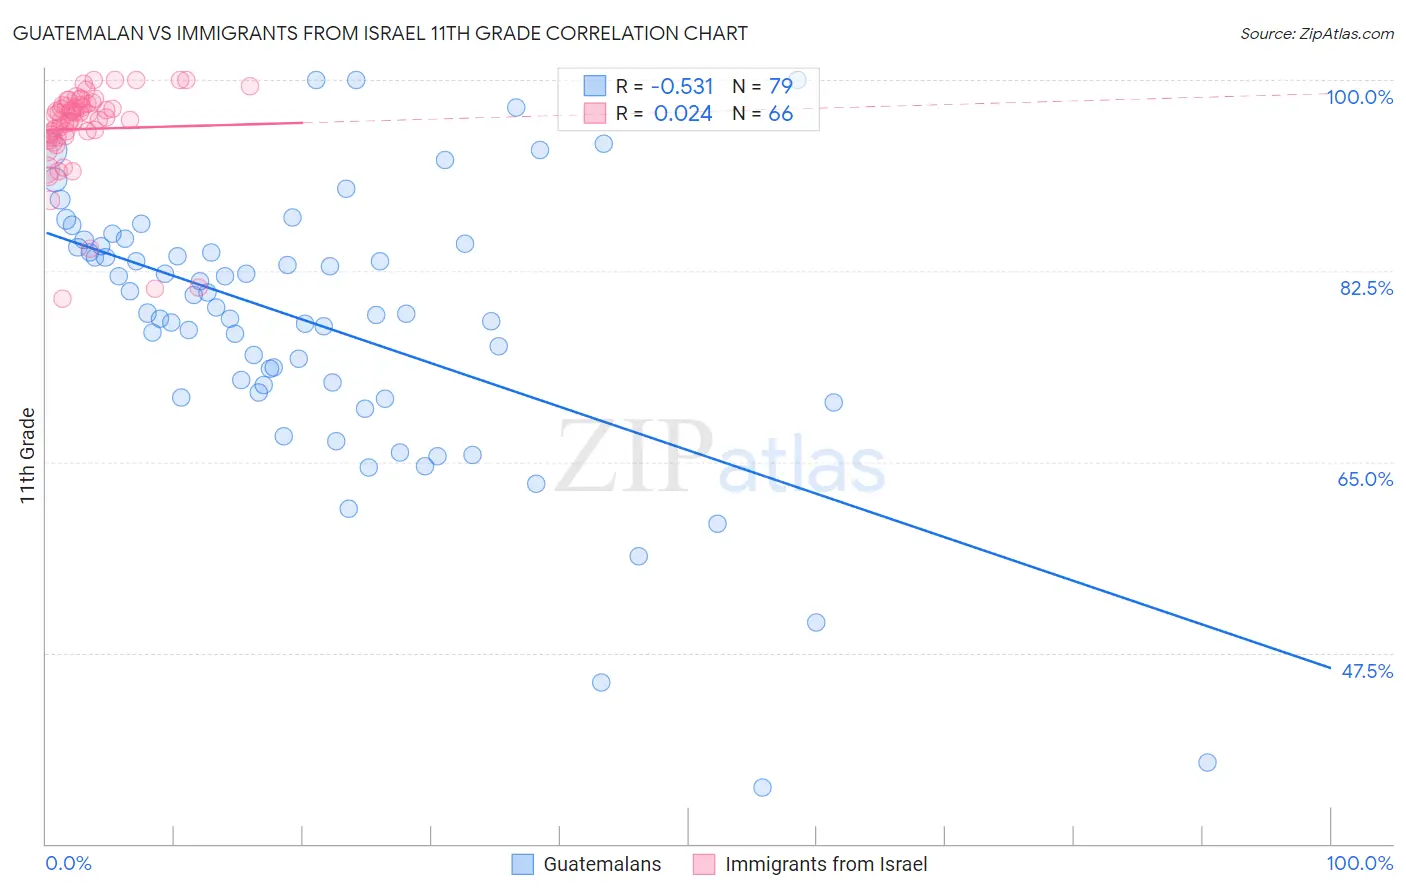
Guatemalan vs Immigrants from Israel 11th Grade Correlation Chart
The statistical analysis conducted on geographies consisting of 409,566,618 people shows a substantial negative correlation between the proportion of Guatemalans and percentage of population with at least 11th grade education in the United States with a correlation coefficient (R) of -0.531 and weighted average of 86.4%. Similarly, the statistical analysis conducted on geographies consisting of 210,030,386 people shows no correlation between the proportion of Immigrants from Israel and percentage of population with at least 11th grade education in the United States with a correlation coefficient (R) of 0.024 and weighted average of 93.5%, a difference of 8.3%.
11th Grade Correlation Summary
| Measurement | Guatemalan | Immigrants from Israel |
| Minimum | 35.2% | 79.9% |
| Maximum | 100.0% | 100.0% |
| Range | 64.8% | 20.1% |
| Mean | 77.6% | 95.5% |
| Median | 78.6% | 96.7% |
| Interquartile 25% (IQ1) | 71.4% | 94.8% |
| Interquartile 75% (IQ3) | 84.8% | 97.7% |
| Interquartile Range (IQR) | 13.4% | 2.9% |
| Standard Deviation (Sample) | 12.6% | 4.3% |
| Standard Deviation (Population) | 12.5% | 4.2% |
Similar Demographics by 11th Grade
Demographics Similar to Guatemalans by 11th Grade
In terms of 11th grade, the demographic groups most similar to Guatemalans are Salvadoran (86.2%, a difference of 0.23%), Mexican (86.1%, a difference of 0.29%), Immigrants from Latin America (86.8%, a difference of 0.49%), Immigrants from Honduras (86.9%, a difference of 0.61%), and Immigrants from Dominican Republic (86.9%, a difference of 0.62%).
| Demographics | Rating | Rank | 11th Grade |
| Immigrants | Azores | 0.0 /100 | #332 | Tragic 87.2% |
| Immigrants | Yemen | 0.0 /100 | #333 | Tragic 87.1% |
| Houma | 0.0 /100 | #334 | Tragic 87.0% |
| Central Americans | 0.0 /100 | #335 | Tragic 86.9% |
| Immigrants | Dominican Republic | 0.0 /100 | #336 | Tragic 86.9% |
| Immigrants | Honduras | 0.0 /100 | #337 | Tragic 86.9% |
| Immigrants | Latin America | 0.0 /100 | #338 | Tragic 86.8% |
| Guatemalans | 0.0 /100 | #339 | Tragic 86.4% |
| Salvadorans | 0.0 /100 | #340 | Tragic 86.2% |
| Mexicans | 0.0 /100 | #341 | Tragic 86.1% |
| Immigrants | Guatemala | 0.0 /100 | #342 | Tragic 85.8% |
| Immigrants | El Salvador | 0.0 /100 | #343 | Tragic 85.3% |
| Yakama | 0.0 /100 | #344 | Tragic 85.0% |
| Immigrants | Central America | 0.0 /100 | #345 | Tragic 84.9% |
| Spanish American Indians | 0.0 /100 | #346 | Tragic 84.7% |
Demographics Similar to Immigrants from Israel by 11th Grade
In terms of 11th grade, the demographic groups most similar to Immigrants from Israel are Menominee (93.5%, a difference of 0.0%), Immigrants from North Macedonia (93.5%, a difference of 0.010%), Immigrants from Iran (93.5%, a difference of 0.020%), Immigrants from Romania (93.5%, a difference of 0.020%), and Immigrants from Turkey (93.5%, a difference of 0.030%).
| Demographics | Rating | Rank | 11th Grade |
| South Africans | 99.2 /100 | #91 | Exceptional 93.6% |
| Immigrants | Bulgaria | 99.1 /100 | #92 | Exceptional 93.6% |
| Puget Sound Salish | 99.1 /100 | #93 | Exceptional 93.6% |
| Swiss | 99.0 /100 | #94 | Exceptional 93.6% |
| Immigrants | France | 99.0 /100 | #95 | Exceptional 93.6% |
| Immigrants | Turkey | 98.9 /100 | #96 | Exceptional 93.5% |
| Immigrants | Iran | 98.9 /100 | #97 | Exceptional 93.5% |
| Immigrants | Israel | 98.8 /100 | #98 | Exceptional 93.5% |
| Menominee | 98.7 /100 | #99 | Exceptional 93.5% |
| Immigrants | North Macedonia | 98.7 /100 | #100 | Exceptional 93.5% |
| Immigrants | Romania | 98.7 /100 | #101 | Exceptional 93.5% |
| Chippewa | 98.6 /100 | #102 | Exceptional 93.5% |
| Lebanese | 98.6 /100 | #103 | Exceptional 93.5% |
| Immigrants | Europe | 98.6 /100 | #104 | Exceptional 93.5% |
| Immigrants | Serbia | 98.6 /100 | #105 | Exceptional 93.5% |