Guatemalan vs Immigrants from Hong Kong 7th Grade
COMPARE
Guatemalan
Immigrants from Hong Kong
7th Grade
7th Grade Comparison
Guatemalans
Immigrants from Hong Kong
91.7%
7TH GRADE
0.0/ 100
METRIC RATING
341st/ 347
METRIC RANK
95.2%
7TH GRADE
0.3/ 100
METRIC RATING
268th/ 347
METRIC RANK
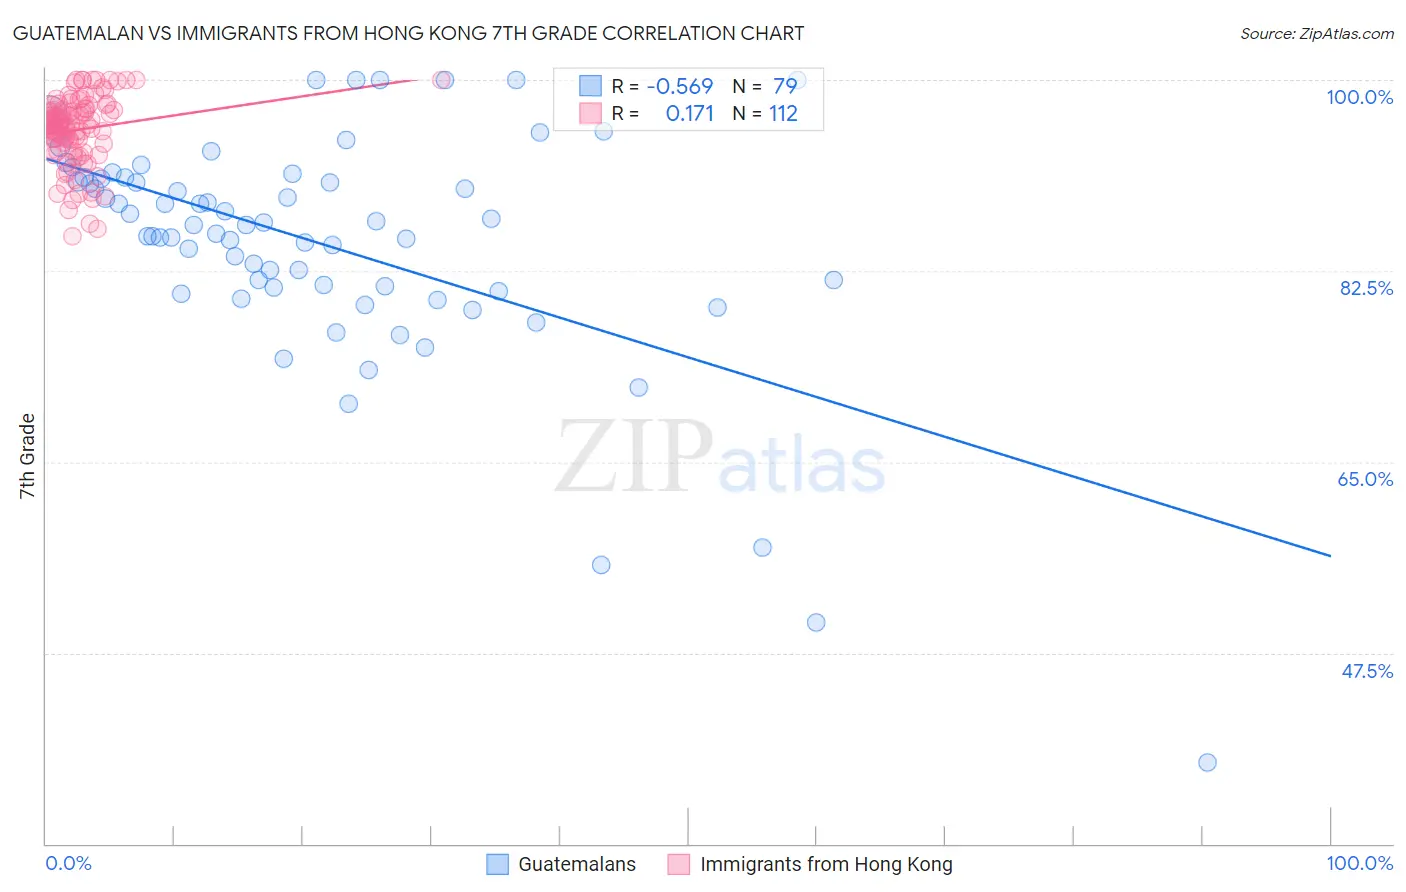
Guatemalan vs Immigrants from Hong Kong 7th Grade Correlation Chart
The statistical analysis conducted on geographies consisting of 409,566,618 people shows a substantial negative correlation between the proportion of Guatemalans and percentage of population with at least 7th grade education in the United States with a correlation coefficient (R) of -0.569 and weighted average of 91.7%. Similarly, the statistical analysis conducted on geographies consisting of 253,949,931 people shows a poor positive correlation between the proportion of Immigrants from Hong Kong and percentage of population with at least 7th grade education in the United States with a correlation coefficient (R) of 0.171 and weighted average of 95.2%, a difference of 3.8%.
7th Grade Correlation Summary
| Measurement | Guatemalan | Immigrants from Hong Kong |
| Minimum | 37.5% | 85.7% |
| Maximum | 100.0% | 100.0% |
| Range | 62.5% | 14.3% |
| Mean | 85.1% | 95.4% |
| Median | 86.8% | 95.9% |
| Interquartile 25% (IQ1) | 81.0% | 94.2% |
| Interquartile 75% (IQ3) | 91.1% | 97.3% |
| Interquartile Range (IQR) | 10.1% | 3.1% |
| Standard Deviation (Sample) | 10.8% | 3.2% |
| Standard Deviation (Population) | 10.7% | 3.1% |
Similar Demographics by 7th Grade
Demographics Similar to Guatemalans by 7th Grade
In terms of 7th grade, the demographic groups most similar to Guatemalans are Yakama (91.7%, a difference of 0.020%), Mexican (91.9%, a difference of 0.21%), Salvadoran (91.5%, a difference of 0.27%), Immigrants from Guatemala (91.3%, a difference of 0.43%), and Central American (92.1%, a difference of 0.46%).
| Demographics | Rating | Rank | 7th Grade |
| Immigrants | Armenia | 0.0 /100 | #333 | Tragic 92.7% |
| Immigrants | Yemen | 0.0 /100 | #334 | Tragic 92.6% |
| Mexican American Indians | 0.0 /100 | #335 | Tragic 92.6% |
| Immigrants | Honduras | 0.0 /100 | #336 | Tragic 92.5% |
| Immigrants | Latin America | 0.0 /100 | #337 | Tragic 92.2% |
| Central Americans | 0.0 /100 | #338 | Tragic 92.1% |
| Mexicans | 0.0 /100 | #339 | Tragic 91.9% |
| Yakama | 0.0 /100 | #340 | Tragic 91.7% |
| Guatemalans | 0.0 /100 | #341 | Tragic 91.7% |
| Salvadorans | 0.0 /100 | #342 | Tragic 91.5% |
| Immigrants | Guatemala | 0.0 /100 | #343 | Tragic 91.3% |
| Immigrants | Central America | 0.0 /100 | #344 | Tragic 91.0% |
| Immigrants | El Salvador | 0.0 /100 | #345 | Tragic 90.9% |
| Immigrants | Mexico | 0.0 /100 | #346 | Tragic 90.7% |
| Spanish American Indians | 0.0 /100 | #347 | Tragic 90.3% |
Demographics Similar to Immigrants from Hong Kong by 7th Grade
In terms of 7th grade, the demographic groups most similar to Immigrants from Hong Kong are Yuman (95.2%, a difference of 0.010%), Immigrants from Uruguay (95.2%, a difference of 0.020%), Immigrants from Ghana (95.2%, a difference of 0.020%), Trinidadian and Tobagonian (95.2%, a difference of 0.020%), and Houma (95.1%, a difference of 0.040%).
| Demographics | Rating | Rank | 7th Grade |
| South Americans | 0.5 /100 | #261 | Tragic 95.2% |
| Immigrants | Somalia | 0.5 /100 | #262 | Tragic 95.2% |
| West Indians | 0.5 /100 | #263 | Tragic 95.2% |
| Immigrants | Nigeria | 0.4 /100 | #264 | Tragic 95.2% |
| Immigrants | Uruguay | 0.3 /100 | #265 | Tragic 95.2% |
| Immigrants | Ghana | 0.3 /100 | #266 | Tragic 95.2% |
| Yuman | 0.3 /100 | #267 | Tragic 95.2% |
| Immigrants | Hong Kong | 0.3 /100 | #268 | Tragic 95.2% |
| Trinidadians and Tobagonians | 0.3 /100 | #269 | Tragic 95.2% |
| Houma | 0.2 /100 | #270 | Tragic 95.1% |
| Immigrants | South America | 0.2 /100 | #271 | Tragic 95.1% |
| Peruvians | 0.2 /100 | #272 | Tragic 95.1% |
| Immigrants | Uzbekistan | 0.2 /100 | #273 | Tragic 95.1% |
| Immigrants | Western Africa | 0.2 /100 | #274 | Tragic 95.1% |
| Immigrants | Colombia | 0.2 /100 | #275 | Tragic 95.1% |