Greek vs Bermudan 7th Grade
COMPARE
Greek
Bermudan
7th Grade
7th Grade Comparison
Greeks
Bermudans
97.0%
7TH GRADE
99.9/ 100
METRIC RATING
52nd/ 347
METRIC RANK
96.1%
7TH GRADE
66.3/ 100
METRIC RATING
161st/ 347
METRIC RANK
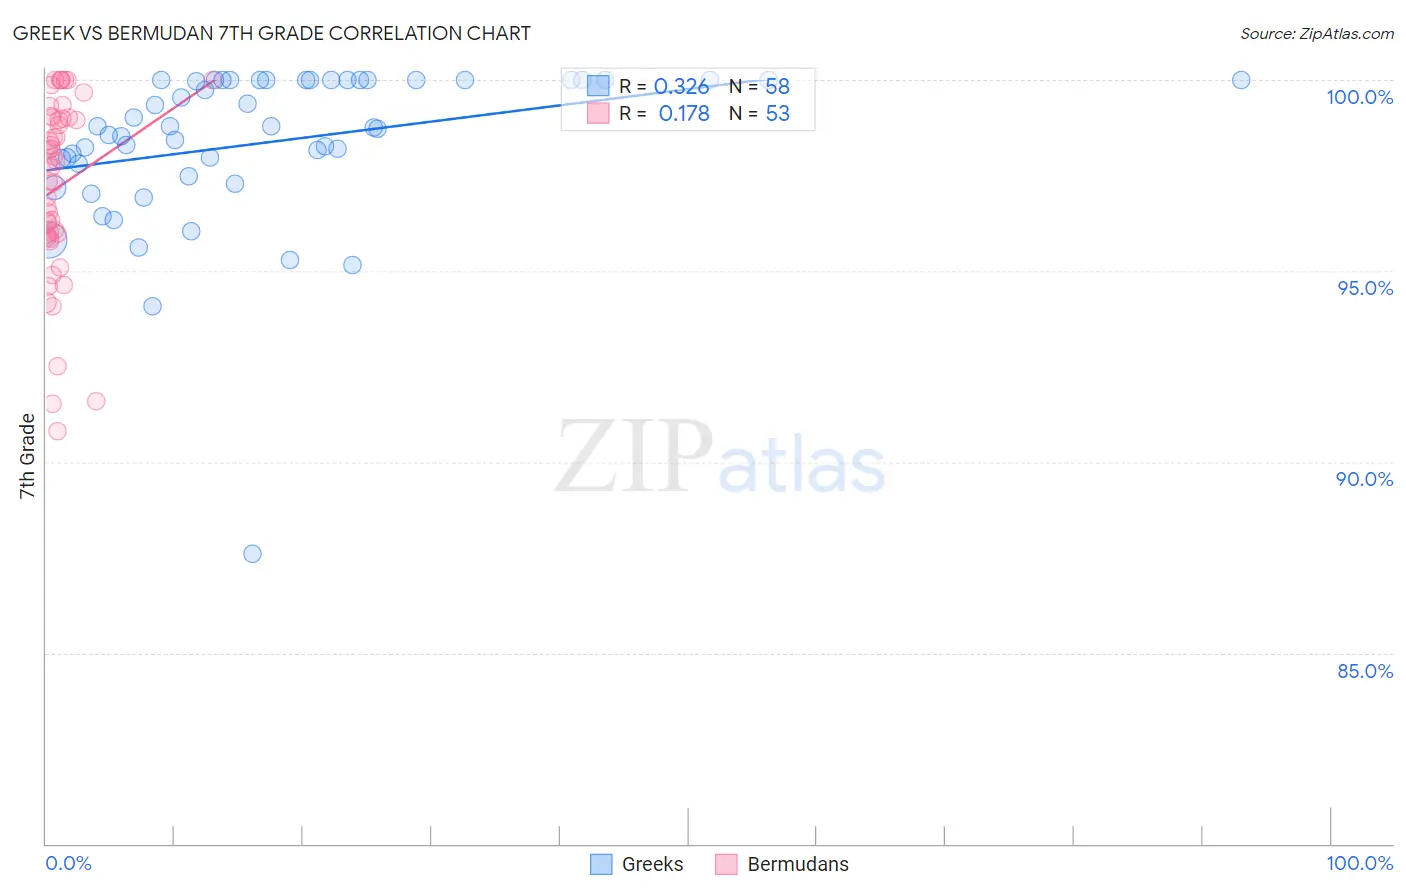
Greek vs Bermudan 7th Grade Correlation Chart
The statistical analysis conducted on geographies consisting of 482,775,358 people shows a mild positive correlation between the proportion of Greeks and percentage of population with at least 7th grade education in the United States with a correlation coefficient (R) of 0.326 and weighted average of 97.0%. Similarly, the statistical analysis conducted on geographies consisting of 55,732,793 people shows a poor positive correlation between the proportion of Bermudans and percentage of population with at least 7th grade education in the United States with a correlation coefficient (R) of 0.178 and weighted average of 96.1%, a difference of 0.90%.
7th Grade Correlation Summary
| Measurement | Greek | Bermudan |
| Minimum | 87.6% | 90.8% |
| Maximum | 100.0% | 100.0% |
| Range | 12.4% | 9.2% |
| Mean | 98.4% | 97.2% |
| Median | 98.8% | 97.8% |
| Interquartile 25% (IQ1) | 97.8% | 95.9% |
| Interquartile 75% (IQ3) | 100.0% | 99.0% |
| Interquartile Range (IQR) | 2.2% | 3.1% |
| Standard Deviation (Sample) | 2.1% | 2.4% |
| Standard Deviation (Population) | 2.1% | 2.3% |
Similar Demographics by 7th Grade
Demographics Similar to Greeks by 7th Grade
In terms of 7th grade, the demographic groups most similar to Greeks are Austrian (97.0%, a difference of 0.010%), Estonian (97.0%, a difference of 0.020%), Australian (97.0%, a difference of 0.030%), Russian (97.0%, a difference of 0.040%), and Serbian (97.0%, a difference of 0.040%).
| Demographics | Rating | Rank | 7th Grade |
| Czechoslovakians | 99.9 /100 | #45 | Exceptional 97.1% |
| Aleuts | 99.9 /100 | #46 | Exceptional 97.1% |
| Bulgarians | 99.9 /100 | #47 | Exceptional 97.1% |
| Celtics | 99.9 /100 | #48 | Exceptional 97.1% |
| Slavs | 99.9 /100 | #49 | Exceptional 97.1% |
| Immigrants | Scotland | 99.9 /100 | #50 | Exceptional 97.1% |
| Estonians | 99.9 /100 | #51 | Exceptional 97.0% |
| Greeks | 99.9 /100 | #52 | Exceptional 97.0% |
| Austrians | 99.8 /100 | #53 | Exceptional 97.0% |
| Australians | 99.8 /100 | #54 | Exceptional 97.0% |
| Russians | 99.8 /100 | #55 | Exceptional 97.0% |
| Serbians | 99.8 /100 | #56 | Exceptional 97.0% |
| Americans | 99.8 /100 | #57 | Exceptional 97.0% |
| Whites/Caucasians | 99.8 /100 | #58 | Exceptional 97.0% |
| Macedonians | 99.8 /100 | #59 | Exceptional 97.0% |
Demographics Similar to Bermudans by 7th Grade
In terms of 7th grade, the demographic groups most similar to Bermudans are Immigrants from Kenya (96.1%, a difference of 0.0%), Alsatian (96.1%, a difference of 0.010%), Pima (96.1%, a difference of 0.010%), Arab (96.2%, a difference of 0.020%), and Spaniard (96.1%, a difference of 0.020%).
| Demographics | Rating | Rank | 7th Grade |
| Immigrants | Israel | 77.6 /100 | #154 | Good 96.2% |
| Immigrants | Jordan | 77.0 /100 | #155 | Good 96.2% |
| Kenyans | 76.2 /100 | #156 | Good 96.2% |
| Ugandans | 75.5 /100 | #157 | Good 96.2% |
| Arabs | 68.6 /100 | #158 | Good 96.2% |
| Alsatians | 67.2 /100 | #159 | Good 96.1% |
| Immigrants | Kenya | 66.8 /100 | #160 | Good 96.1% |
| Bermudans | 66.3 /100 | #161 | Good 96.1% |
| Pima | 64.3 /100 | #162 | Good 96.1% |
| Spaniards | 62.6 /100 | #163 | Good 96.1% |
| Immigrants | Italy | 62.1 /100 | #164 | Good 96.1% |
| Immigrants | Taiwan | 61.5 /100 | #165 | Good 96.1% |
| Immigrants | Kazakhstan | 61.0 /100 | #166 | Good 96.1% |
| Immigrants | Sri Lanka | 59.9 /100 | #167 | Average 96.1% |
| Immigrants | Poland | 59.0 /100 | #168 | Average 96.1% |