Guamanian/Chamorro vs U.S. Virgin Islander Kindergarten
COMPARE
Guamanian/Chamorro
U.S. Virgin Islander
Kindergarten
Kindergarten Comparison
Guamanians/Chamorros
U.S. Virgin Islanders
97.9%
KINDERGARTEN
26.2/ 100
METRIC RATING
196th/ 347
METRIC RANK
97.6%
KINDERGARTEN
1.7/ 100
METRIC RATING
239th/ 347
METRIC RANK
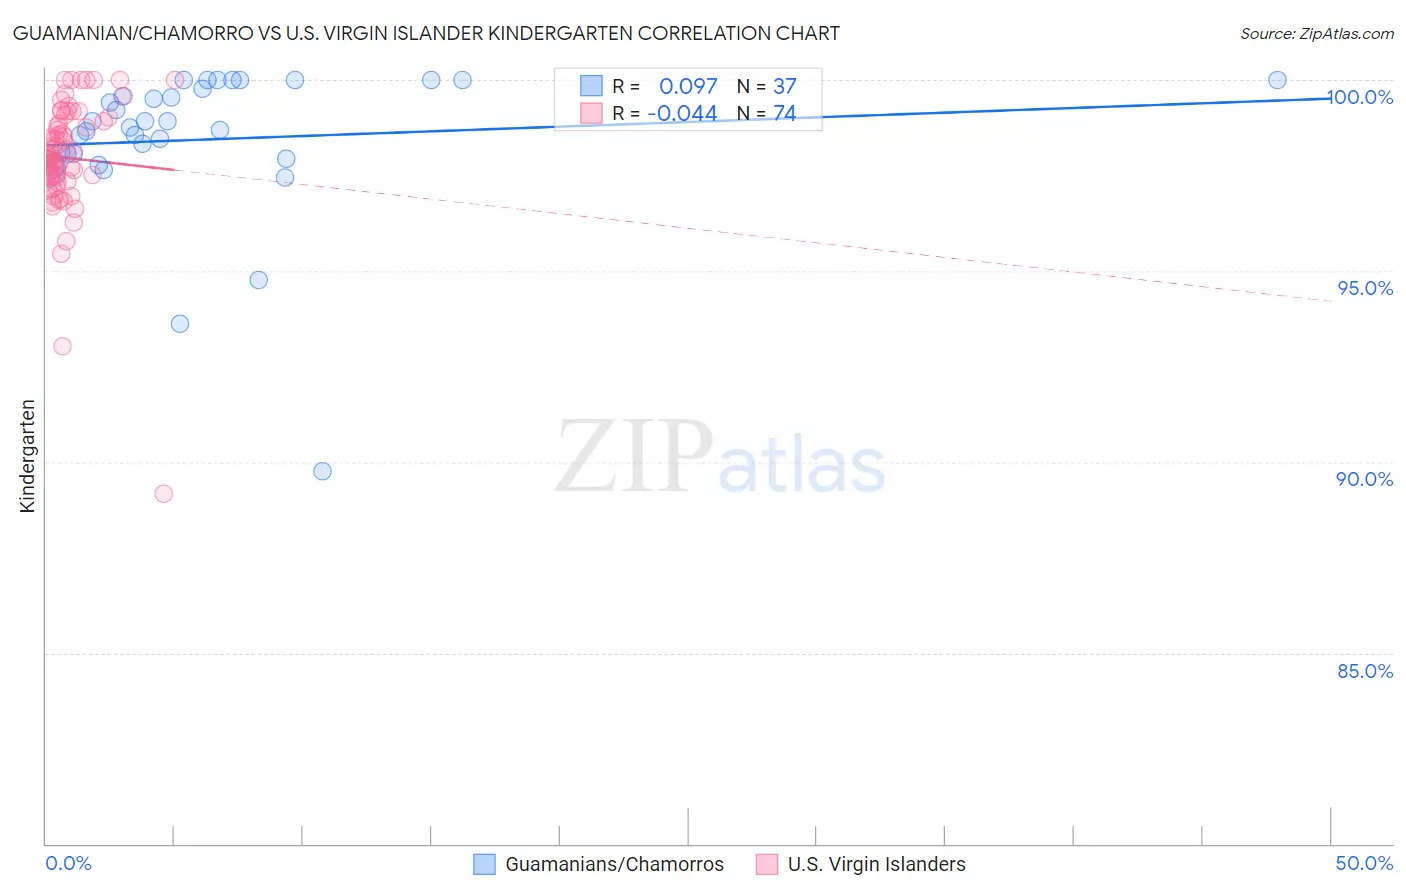
Guamanian/Chamorro vs U.S. Virgin Islander Kindergarten Correlation Chart
The statistical analysis conducted on geographies consisting of 221,965,618 people shows a slight positive correlation between the proportion of Guamanians/Chamorros and percentage of population with at least kindergarten education in the United States with a correlation coefficient (R) of 0.097 and weighted average of 97.9%. Similarly, the statistical analysis conducted on geographies consisting of 87,529,315 people shows no correlation between the proportion of U.S. Virgin Islanders and percentage of population with at least kindergarten education in the United States with a correlation coefficient (R) of -0.044 and weighted average of 97.6%, a difference of 0.23%.
Kindergarten Correlation Summary
| Measurement | Guamanian/Chamorro | U.S. Virgin Islander |
| Minimum | 89.7% | 89.2% |
| Maximum | 100.0% | 100.0% |
| Range | 10.3% | 10.8% |
| Mean | 98.4% | 98.0% |
| Median | 98.8% | 98.0% |
| Interquartile 25% (IQ1) | 98.0% | 97.5% |
| Interquartile 75% (IQ3) | 99.9% | 98.9% |
| Interquartile Range (IQR) | 1.9% | 1.5% |
| Standard Deviation (Sample) | 2.0% | 1.6% |
| Standard Deviation (Population) | 2.0% | 1.6% |
Similar Demographics by Kindergarten
Demographics Similar to Guamanians/Chamorros by Kindergarten
In terms of kindergarten, the demographic groups most similar to Guamanians/Chamorros are Immigrants from Kenya (97.9%, a difference of 0.0%), Black/African American (97.9%, a difference of 0.010%), Paraguayan (97.9%, a difference of 0.010%), Hawaiian (97.9%, a difference of 0.010%), and Mongolian (97.9%, a difference of 0.010%).
| Demographics | Rating | Rank | Kindergarten |
| Paiute | 34.7 /100 | #189 | Fair 97.9% |
| Panamanians | 33.3 /100 | #190 | Fair 97.9% |
| Immigrants | Taiwan | 30.7 /100 | #191 | Fair 97.9% |
| Blacks/African Americans | 29.9 /100 | #192 | Fair 97.9% |
| Paraguayans | 29.6 /100 | #193 | Fair 97.9% |
| Hawaiians | 29.3 /100 | #194 | Fair 97.9% |
| Mongolians | 28.9 /100 | #195 | Fair 97.9% |
| Guamanians/Chamorros | 26.2 /100 | #196 | Fair 97.9% |
| Immigrants | Kenya | 25.5 /100 | #197 | Fair 97.9% |
| Tohono O'odham | 24.6 /100 | #198 | Fair 97.9% |
| Immigrants | Egypt | 22.3 /100 | #199 | Fair 97.9% |
| Yuman | 21.6 /100 | #200 | Fair 97.9% |
| Immigrants | Lebanon | 20.9 /100 | #201 | Fair 97.9% |
| Immigrants | Ukraine | 19.1 /100 | #202 | Poor 97.8% |
| Immigrants | Uganda | 18.8 /100 | #203 | Poor 97.8% |
Demographics Similar to U.S. Virgin Islanders by Kindergarten
In terms of kindergarten, the demographic groups most similar to U.S. Virgin Islanders are Nigerian (97.6%, a difference of 0.0%), Immigrants from Eastern Asia (97.6%, a difference of 0.0%), Korean (97.6%, a difference of 0.010%), Immigrants from Pakistan (97.7%, a difference of 0.020%), and Immigrants from Malaysia (97.7%, a difference of 0.020%).
| Demographics | Rating | Rank | Kindergarten |
| Immigrants | Uruguay | 2.6 /100 | #232 | Tragic 97.7% |
| Immigrants | Pakistan | 2.2 /100 | #233 | Tragic 97.7% |
| Immigrants | Malaysia | 2.2 /100 | #234 | Tragic 97.7% |
| Colombians | 2.2 /100 | #235 | Tragic 97.7% |
| Immigrants | Western Asia | 2.1 /100 | #236 | Tragic 97.7% |
| Nigerians | 1.8 /100 | #237 | Tragic 97.6% |
| Immigrants | Eastern Asia | 1.7 /100 | #238 | Tragic 97.6% |
| U.S. Virgin Islanders | 1.7 /100 | #239 | Tragic 97.6% |
| Koreans | 1.6 /100 | #240 | Tragic 97.6% |
| Liberians | 1.3 /100 | #241 | Tragic 97.6% |
| Immigrants | Indonesia | 1.3 /100 | #242 | Tragic 97.6% |
| Asians | 1.2 /100 | #243 | Tragic 97.6% |
| Bolivians | 1.2 /100 | #244 | Tragic 97.6% |
| South Americans | 1.1 /100 | #245 | Tragic 97.6% |
| Indians (Asian) | 1.0 /100 | #246 | Tragic 97.6% |