Guamanian/Chamorro vs Barbadian High School Diploma
COMPARE
Guamanian/Chamorro
Barbadian
High School Diploma
High School Diploma Comparison
Guamanians/Chamorros
Barbadians
88.9%
HIGH SCHOOL DIPLOMA
35.5/ 100
METRIC RATING
187th/ 347
METRIC RANK
86.7%
HIGH SCHOOL DIPLOMA
0.1/ 100
METRIC RATING
277th/ 347
METRIC RANK
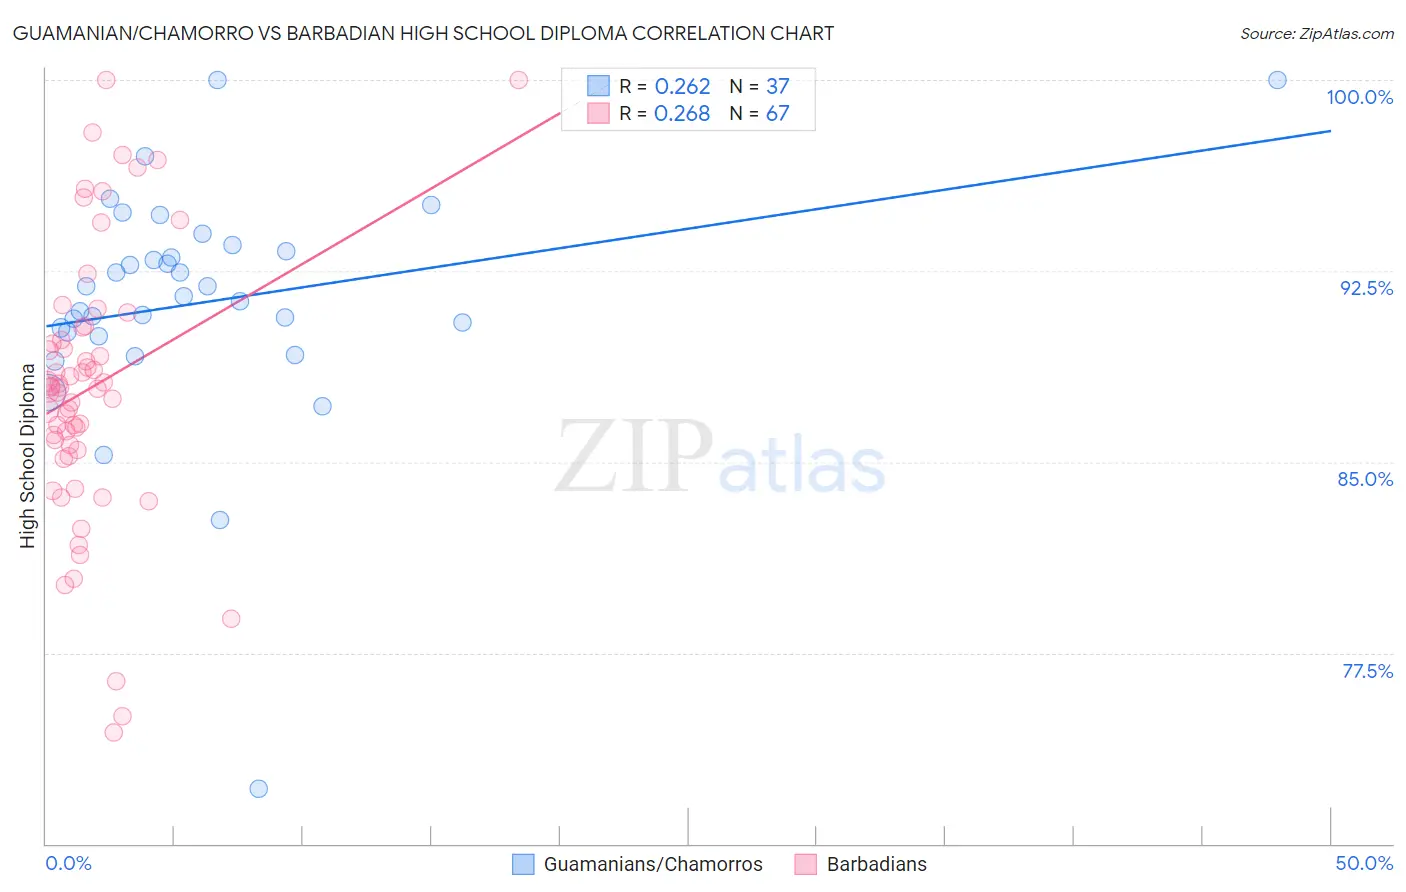
Guamanian/Chamorro vs Barbadian High School Diploma Correlation Chart
The statistical analysis conducted on geographies consisting of 221,965,618 people shows a weak positive correlation between the proportion of Guamanians/Chamorros and percentage of population with at least high school diploma education in the United States with a correlation coefficient (R) of 0.262 and weighted average of 88.9%. Similarly, the statistical analysis conducted on geographies consisting of 141,304,590 people shows a weak positive correlation between the proportion of Barbadians and percentage of population with at least high school diploma education in the United States with a correlation coefficient (R) of 0.268 and weighted average of 86.7%, a difference of 2.6%.
High School Diploma Correlation Summary
| Measurement | Guamanian/Chamorro | Barbadian |
| Minimum | 72.2% | 74.4% |
| Maximum | 100.0% | 100.0% |
| Range | 27.8% | 25.6% |
| Mean | 91.3% | 87.9% |
| Median | 91.5% | 87.9% |
| Interquartile 25% (IQ1) | 90.0% | 85.4% |
| Interquartile 75% (IQ3) | 93.4% | 90.3% |
| Interquartile Range (IQR) | 3.4% | 4.8% |
| Standard Deviation (Sample) | 4.7% | 5.4% |
| Standard Deviation (Population) | 4.6% | 5.3% |
Similar Demographics by High School Diploma
Demographics Similar to Guamanians/Chamorros by High School Diploma
In terms of high school diploma, the demographic groups most similar to Guamanians/Chamorros are Immigrants from Eastern Africa (88.9%, a difference of 0.0%), Ethiopian (89.0%, a difference of 0.020%), Immigrants from Sudan (88.9%, a difference of 0.040%), Immigrants from Uganda (88.9%, a difference of 0.050%), and Immigrants from Syria (89.0%, a difference of 0.060%).
| Demographics | Rating | Rank | High School Diploma |
| Bolivians | 45.2 /100 | #180 | Average 89.1% |
| Venezuelans | 43.6 /100 | #181 | Average 89.1% |
| Spaniards | 43.4 /100 | #182 | Average 89.1% |
| Potawatomi | 42.5 /100 | #183 | Average 89.0% |
| Immigrants | Syria | 39.2 /100 | #184 | Fair 89.0% |
| Ethiopians | 37.0 /100 | #185 | Fair 89.0% |
| Immigrants | Eastern Africa | 35.8 /100 | #186 | Fair 88.9% |
| Guamanians/Chamorros | 35.5 /100 | #187 | Fair 88.9% |
| Immigrants | Sudan | 33.4 /100 | #188 | Fair 88.9% |
| Immigrants | Uganda | 32.6 /100 | #189 | Fair 88.9% |
| Immigrants | Chile | 31.9 /100 | #190 | Fair 88.9% |
| Immigrants | Ethiopia | 30.9 /100 | #191 | Fair 88.9% |
| Moroccans | 29.5 /100 | #192 | Fair 88.8% |
| Immigrants | Oceania | 26.9 /100 | #193 | Fair 88.8% |
| Immigrants | Venezuela | 25.8 /100 | #194 | Fair 88.8% |
Demographics Similar to Barbadians by High School Diploma
In terms of high school diploma, the demographic groups most similar to Barbadians are Immigrants from Burma/Myanmar (86.7%, a difference of 0.010%), Immigrants from Trinidad and Tobago (86.8%, a difference of 0.080%), Hopi (86.6%, a difference of 0.11%), Immigrants from Laos (86.6%, a difference of 0.15%), and Pueblo (86.5%, a difference of 0.17%).
| Demographics | Rating | Rank | High School Diploma |
| Malaysians | 0.2 /100 | #270 | Tragic 87.0% |
| West Indians | 0.1 /100 | #271 | Tragic 86.9% |
| Trinidadians and Tobagonians | 0.1 /100 | #272 | Tragic 86.9% |
| Immigrants | Jamaica | 0.1 /100 | #273 | Tragic 86.9% |
| Bangladeshis | 0.1 /100 | #274 | Tragic 86.9% |
| Immigrants | Trinidad and Tobago | 0.1 /100 | #275 | Tragic 86.8% |
| Immigrants | Burma/Myanmar | 0.1 /100 | #276 | Tragic 86.7% |
| Barbadians | 0.1 /100 | #277 | Tragic 86.7% |
| Hopi | 0.1 /100 | #278 | Tragic 86.6% |
| Immigrants | Laos | 0.0 /100 | #279 | Tragic 86.6% |
| Pueblo | 0.0 /100 | #280 | Tragic 86.5% |
| Indonesians | 0.0 /100 | #281 | Tragic 86.5% |
| Dutch West Indians | 0.0 /100 | #282 | Tragic 86.5% |
| Immigrants | Barbados | 0.0 /100 | #283 | Tragic 86.4% |
| Paiute | 0.0 /100 | #284 | Tragic 86.4% |