Guamanian/Chamorro vs Immigrants from Uruguay Householder Income Ages 25 - 44 years
COMPARE
Guamanian/Chamorro
Immigrants from Uruguay
Householder Income Ages 25 - 44 years
Householder Income Ages 25 - 44 years Comparison
Guamanians/Chamorros
Immigrants from Uruguay
$93,569
HOUSEHOLDER INCOME AGES 25 - 44 YEARS
36.5/ 100
METRIC RATING
183rd/ 347
METRIC RANK
$91,171
HOUSEHOLDER INCOME AGES 25 - 44 YEARS
13.2/ 100
METRIC RATING
209th/ 347
METRIC RANK
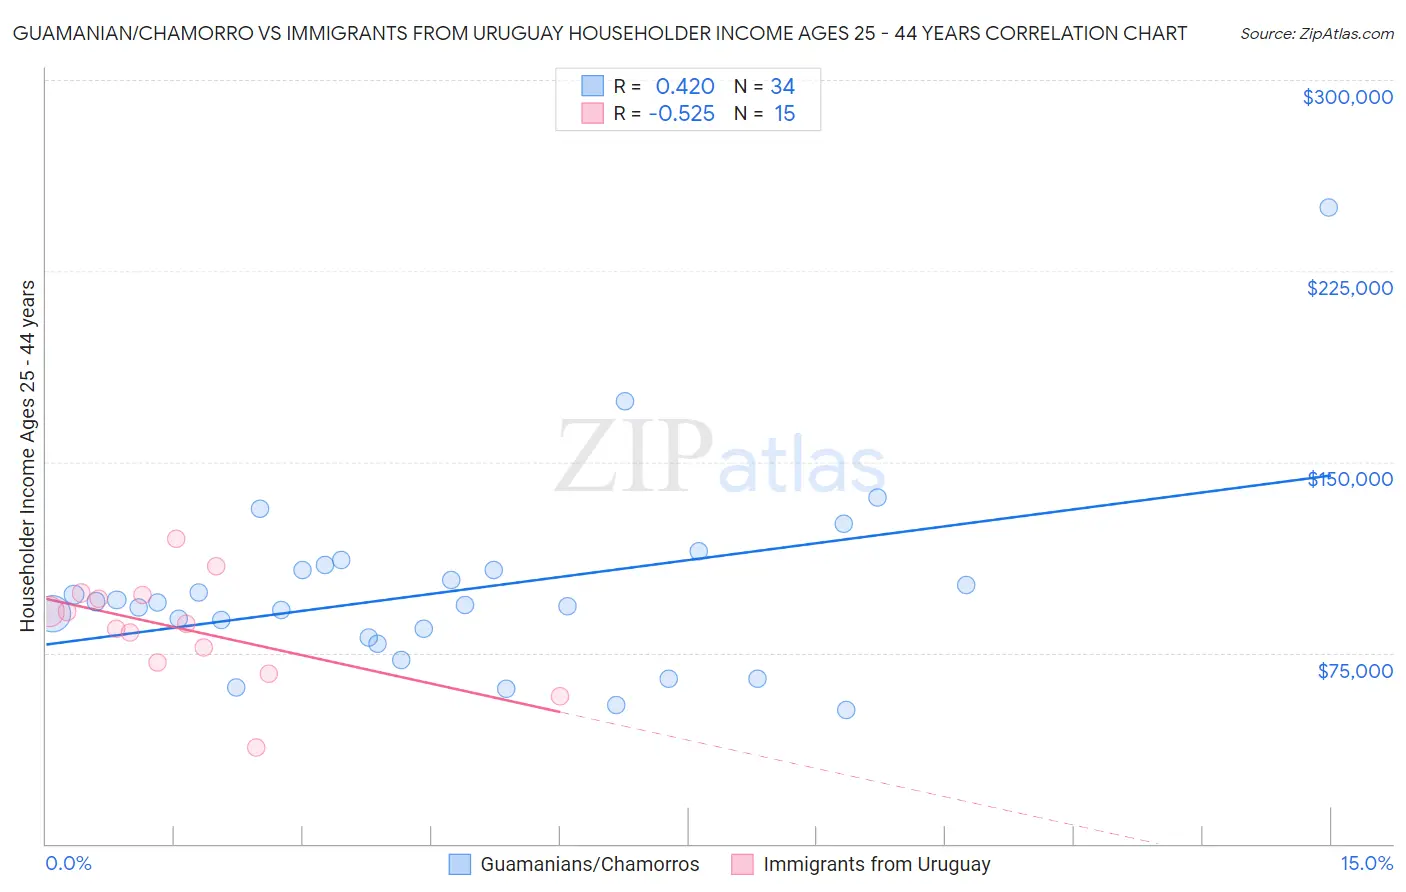
Guamanian/Chamorro vs Immigrants from Uruguay Householder Income Ages 25 - 44 years Correlation Chart
The statistical analysis conducted on geographies consisting of 221,693,514 people shows a moderate positive correlation between the proportion of Guamanians/Chamorros and household income with householder between the ages 25 and 44 in the United States with a correlation coefficient (R) of 0.420 and weighted average of $93,569. Similarly, the statistical analysis conducted on geographies consisting of 133,181,410 people shows a substantial negative correlation between the proportion of Immigrants from Uruguay and household income with householder between the ages 25 and 44 in the United States with a correlation coefficient (R) of -0.525 and weighted average of $91,171, a difference of 2.6%.
Householder Income Ages 25 - 44 years Correlation Summary
| Measurement | Guamanian/Chamorro | Immigrants from Uruguay |
| Minimum | $52,500 | $38,006 |
| Maximum | $250,001 | $119,559 |
| Range | $197,501 | $81,553 |
| Mean | $99,073 | $84,577 |
| Median | $94,237 | $86,424 |
| Interquartile 25% (IQ1) | $81,009 | $71,202 |
| Interquartile 75% (IQ3) | $107,396 | $97,689 |
| Interquartile Range (IQR) | $26,387 | $26,487 |
| Standard Deviation (Sample) | $36,403 | $20,417 |
| Standard Deviation (Population) | $35,864 | $19,725 |
Similar Demographics by Householder Income Ages 25 - 44 years
Demographics Similar to Guamanians/Chamorros by Householder Income Ages 25 - 44 years
In terms of householder income ages 25 - 44 years, the demographic groups most similar to Guamanians/Chamorros are German ($93,531, a difference of 0.040%), Uruguayan ($93,631, a difference of 0.070%), French ($93,665, a difference of 0.10%), Puget Sound Salish ($93,661, a difference of 0.10%), and Immigrants from Eritrea ($93,466, a difference of 0.11%).
| Demographics | Rating | Rank | Householder Income Ages 25 - 44 years |
| Immigrants | Immigrants | 48.0 /100 | #176 | Average $94,423 |
| Belgians | 45.8 /100 | #177 | Average $94,262 |
| Immigrants | South America | 42.8 /100 | #178 | Average $94,042 |
| French Canadians | 38.2 /100 | #179 | Fair $93,694 |
| French | 37.8 /100 | #180 | Fair $93,665 |
| Puget Sound Salish | 37.7 /100 | #181 | Fair $93,661 |
| Uruguayans | 37.3 /100 | #182 | Fair $93,631 |
| Guamanians/Chamorros | 36.5 /100 | #183 | Fair $93,569 |
| Germans | 36.0 /100 | #184 | Fair $93,531 |
| Immigrants | Eritrea | 35.2 /100 | #185 | Fair $93,466 |
| Sierra Leoneans | 34.8 /100 | #186 | Fair $93,435 |
| Spaniards | 34.0 /100 | #187 | Fair $93,366 |
| Immigrants | Sierra Leone | 30.9 /100 | #188 | Fair $93,115 |
| Dutch | 30.5 /100 | #189 | Fair $93,081 |
| Welsh | 30.0 /100 | #190 | Fair $93,039 |
Demographics Similar to Immigrants from Uruguay by Householder Income Ages 25 - 44 years
In terms of householder income ages 25 - 44 years, the demographic groups most similar to Immigrants from Uruguay are Immigrants from Thailand ($91,337, a difference of 0.18%), Aleut ($91,370, a difference of 0.22%), Yugoslavian ($91,368, a difference of 0.22%), Immigrants from Eastern Africa ($91,458, a difference of 0.32%), and Nepalese ($91,498, a difference of 0.36%).
| Demographics | Rating | Rank | Householder Income Ages 25 - 44 years |
| Ecuadorians | 16.0 /100 | #202 | Poor $91,574 |
| Immigrants | Cambodia | 15.7 /100 | #203 | Poor $91,533 |
| Nepalese | 15.4 /100 | #204 | Poor $91,498 |
| Immigrants | Eastern Africa | 15.2 /100 | #205 | Poor $91,458 |
| Aleuts | 14.5 /100 | #206 | Poor $91,370 |
| Yugoslavians | 14.5 /100 | #207 | Poor $91,368 |
| Immigrants | Thailand | 14.3 /100 | #208 | Poor $91,337 |
| Immigrants | Uruguay | 13.2 /100 | #209 | Poor $91,171 |
| Immigrants | Kenya | 10.9 /100 | #210 | Poor $90,767 |
| Iraqis | 10.8 /100 | #211 | Poor $90,764 |
| Hawaiians | 10.6 /100 | #212 | Poor $90,722 |
| Immigrants | Bangladesh | 9.3 /100 | #213 | Tragic $90,448 |
| Immigrants | Africa | 8.9 /100 | #214 | Tragic $90,372 |
| Panamanians | 8.1 /100 | #215 | Tragic $90,193 |
| Ghanaians | 7.9 /100 | #216 | Tragic $90,137 |