Guamanian/Chamorro vs Guyanese High School Diploma
COMPARE
Guamanian/Chamorro
Guyanese
High School Diploma
High School Diploma Comparison
Guamanians/Chamorros
Guyanese
88.9%
HIGH SCHOOL DIPLOMA
35.5/ 100
METRIC RATING
187th/ 347
METRIC RANK
85.5%
HIGH SCHOOL DIPLOMA
0.0/ 100
METRIC RATING
299th/ 347
METRIC RANK
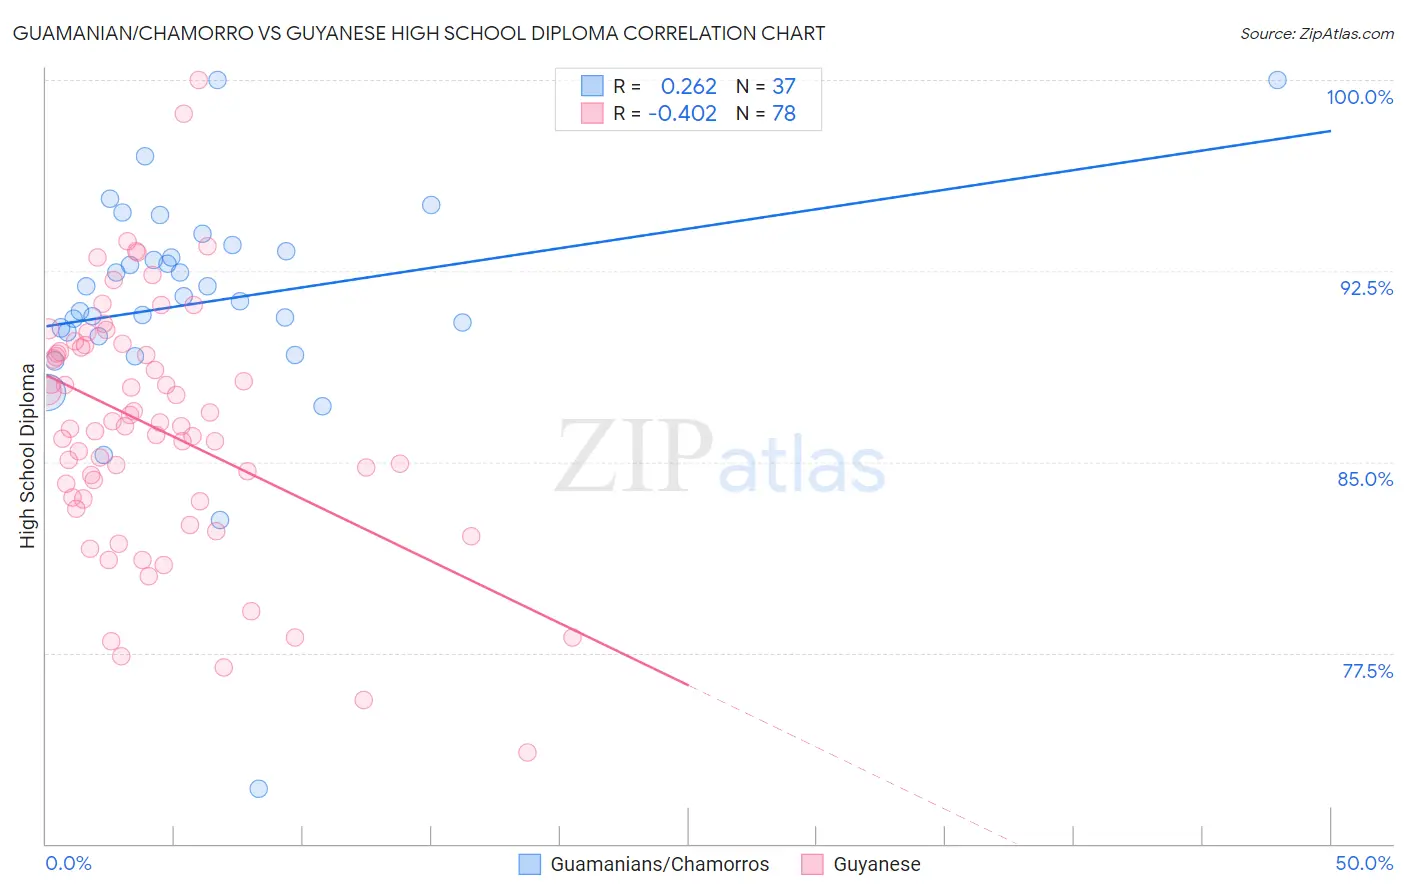
Guamanian/Chamorro vs Guyanese High School Diploma Correlation Chart
The statistical analysis conducted on geographies consisting of 221,965,618 people shows a weak positive correlation between the proportion of Guamanians/Chamorros and percentage of population with at least high school diploma education in the United States with a correlation coefficient (R) of 0.262 and weighted average of 88.9%. Similarly, the statistical analysis conducted on geographies consisting of 176,933,658 people shows a moderate negative correlation between the proportion of Guyanese and percentage of population with at least high school diploma education in the United States with a correlation coefficient (R) of -0.402 and weighted average of 85.5%, a difference of 4.1%.
High School Diploma Correlation Summary
| Measurement | Guamanian/Chamorro | Guyanese |
| Minimum | 72.2% | 73.6% |
| Maximum | 100.0% | 100.0% |
| Range | 27.8% | 26.4% |
| Mean | 91.3% | 86.3% |
| Median | 91.5% | 86.4% |
| Interquartile 25% (IQ1) | 90.0% | 83.5% |
| Interquartile 75% (IQ3) | 93.4% | 89.5% |
| Interquartile Range (IQR) | 3.4% | 6.0% |
| Standard Deviation (Sample) | 4.7% | 4.9% |
| Standard Deviation (Population) | 4.6% | 4.9% |
Similar Demographics by High School Diploma
Demographics Similar to Guamanians/Chamorros by High School Diploma
In terms of high school diploma, the demographic groups most similar to Guamanians/Chamorros are Immigrants from Eastern Africa (88.9%, a difference of 0.0%), Ethiopian (89.0%, a difference of 0.020%), Immigrants from Sudan (88.9%, a difference of 0.040%), Immigrants from Uganda (88.9%, a difference of 0.050%), and Immigrants from Syria (89.0%, a difference of 0.060%).
| Demographics | Rating | Rank | High School Diploma |
| Bolivians | 45.2 /100 | #180 | Average 89.1% |
| Venezuelans | 43.6 /100 | #181 | Average 89.1% |
| Spaniards | 43.4 /100 | #182 | Average 89.1% |
| Potawatomi | 42.5 /100 | #183 | Average 89.0% |
| Immigrants | Syria | 39.2 /100 | #184 | Fair 89.0% |
| Ethiopians | 37.0 /100 | #185 | Fair 89.0% |
| Immigrants | Eastern Africa | 35.8 /100 | #186 | Fair 88.9% |
| Guamanians/Chamorros | 35.5 /100 | #187 | Fair 88.9% |
| Immigrants | Sudan | 33.4 /100 | #188 | Fair 88.9% |
| Immigrants | Uganda | 32.6 /100 | #189 | Fair 88.9% |
| Immigrants | Chile | 31.9 /100 | #190 | Fair 88.9% |
| Immigrants | Ethiopia | 30.9 /100 | #191 | Fair 88.9% |
| Moroccans | 29.5 /100 | #192 | Fair 88.8% |
| Immigrants | Oceania | 26.9 /100 | #193 | Fair 88.8% |
| Immigrants | Venezuela | 25.8 /100 | #194 | Fair 88.8% |
Demographics Similar to Guyanese by High School Diploma
In terms of high school diploma, the demographic groups most similar to Guyanese are Immigrants from Bangladesh (85.5%, a difference of 0.020%), Vietnamese (85.4%, a difference of 0.040%), Immigrants from Haiti (85.4%, a difference of 0.080%), Cuban (85.4%, a difference of 0.080%), and Native/Alaskan (85.6%, a difference of 0.10%).
| Demographics | Rating | Rank | High School Diploma |
| Japanese | 0.0 /100 | #292 | Tragic 85.9% |
| British West Indians | 0.0 /100 | #293 | Tragic 85.9% |
| Immigrants | Fiji | 0.0 /100 | #294 | Tragic 85.8% |
| Immigrants | Immigrants | 0.0 /100 | #295 | Tragic 85.8% |
| Immigrants | Cambodia | 0.0 /100 | #296 | Tragic 85.6% |
| Immigrants | Grenada | 0.0 /100 | #297 | Tragic 85.6% |
| Natives/Alaskans | 0.0 /100 | #298 | Tragic 85.6% |
| Guyanese | 0.0 /100 | #299 | Tragic 85.5% |
| Immigrants | Bangladesh | 0.0 /100 | #300 | Tragic 85.5% |
| Vietnamese | 0.0 /100 | #301 | Tragic 85.4% |
| Immigrants | Haiti | 0.0 /100 | #302 | Tragic 85.4% |
| Cubans | 0.0 /100 | #303 | Tragic 85.4% |
| Nepalese | 0.0 /100 | #304 | Tragic 85.3% |
| Immigrants | Portugal | 0.0 /100 | #305 | Tragic 85.3% |
| Immigrants | Guyana | 0.0 /100 | #306 | Tragic 85.3% |