Guamanian/Chamorro vs Hispanic or Latino 10th Grade
COMPARE
Guamanian/Chamorro
Hispanic or Latino
10th Grade
10th Grade Comparison
Guamanians/Chamorros
Hispanics or Latinos
93.6%
10TH GRADE
37.1/ 100
METRIC RATING
183rd/ 347
METRIC RANK
88.9%
10TH GRADE
0.0/ 100
METRIC RATING
334th/ 347
METRIC RANK
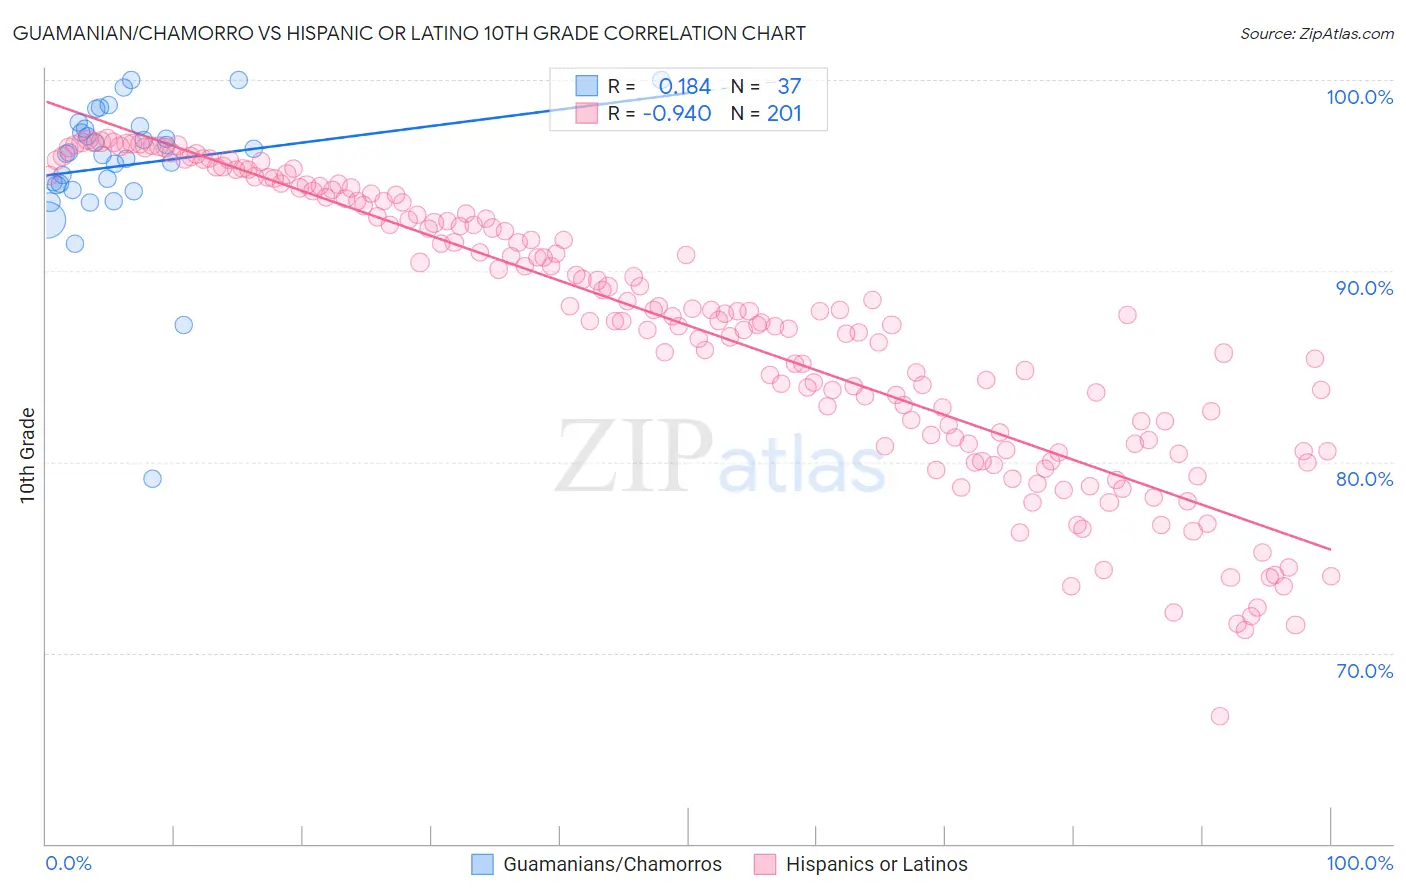
Guamanian/Chamorro vs Hispanic or Latino 10th Grade Correlation Chart
The statistical analysis conducted on geographies consisting of 221,965,618 people shows a poor positive correlation between the proportion of Guamanians/Chamorros and percentage of population with at least 10th grade education in the United States with a correlation coefficient (R) of 0.184 and weighted average of 93.6%. Similarly, the statistical analysis conducted on geographies consisting of 578,613,916 people shows a near-perfect negative correlation between the proportion of Hispanics or Latinos and percentage of population with at least 10th grade education in the United States with a correlation coefficient (R) of -0.940 and weighted average of 88.9%, a difference of 5.4%.
10th Grade Correlation Summary
| Measurement | Guamanian/Chamorro | Hispanic or Latino |
| Minimum | 79.1% | 66.7% |
| Maximum | 100.0% | 96.9% |
| Range | 20.9% | 30.2% |
| Mean | 95.5% | 87.1% |
| Median | 96.1% | 87.8% |
| Interquartile 25% (IQ1) | 94.4% | 81.2% |
| Interquartile 75% (IQ3) | 97.5% | 93.7% |
| Interquartile Range (IQR) | 3.2% | 12.5% |
| Standard Deviation (Sample) | 3.8% | 7.3% |
| Standard Deviation (Population) | 3.7% | 7.2% |
Similar Demographics by 10th Grade
Demographics Similar to Guamanians/Chamorros by 10th Grade
In terms of 10th grade, the demographic groups most similar to Guamanians/Chamorros are Choctaw (93.6%, a difference of 0.0%), Sudanese (93.6%, a difference of 0.0%), Colville (93.6%, a difference of 0.020%), Immigrants from Eastern Asia (93.6%, a difference of 0.020%), and Liberian (93.6%, a difference of 0.020%).
| Demographics | Rating | Rank | 10th Grade |
| Immigrants | Argentina | 47.1 /100 | #176 | Average 93.7% |
| Immigrants | Lebanon | 47.1 /100 | #177 | Average 93.7% |
| Sierra Leoneans | 46.1 /100 | #178 | Average 93.7% |
| Paraguayans | 45.3 /100 | #179 | Average 93.7% |
| Blackfeet | 42.8 /100 | #180 | Average 93.7% |
| Immigrants | Northern Africa | 41.6 /100 | #181 | Average 93.7% |
| Colville | 38.8 /100 | #182 | Fair 93.6% |
| Guamanians/Chamorros | 37.1 /100 | #183 | Fair 93.6% |
| Choctaw | 36.6 /100 | #184 | Fair 93.6% |
| Sudanese | 36.6 /100 | #185 | Fair 93.6% |
| Immigrants | Eastern Asia | 35.1 /100 | #186 | Fair 93.6% |
| Liberians | 34.7 /100 | #187 | Fair 93.6% |
| Marshallese | 33.2 /100 | #188 | Fair 93.6% |
| Immigrants | Pakistan | 32.5 /100 | #189 | Fair 93.6% |
| Laotians | 32.1 /100 | #190 | Fair 93.6% |
Demographics Similar to Hispanics or Latinos by 10th Grade
In terms of 10th grade, the demographic groups most similar to Hispanics or Latinos are Honduran (89.0%, a difference of 0.12%), Immigrants from the Azores (89.0%, a difference of 0.15%), Immigrants from Dominican Republic (88.7%, a difference of 0.18%), Mexican American Indian (89.0%, a difference of 0.19%), and Immigrants from Yemen (89.1%, a difference of 0.22%).
| Demographics | Rating | Rank | 10th Grade |
| Immigrants | Nicaragua | 0.0 /100 | #327 | Tragic 89.5% |
| Immigrants | Cabo Verde | 0.0 /100 | #328 | Tragic 89.5% |
| Dominicans | 0.0 /100 | #329 | Tragic 89.4% |
| Immigrants | Yemen | 0.0 /100 | #330 | Tragic 89.1% |
| Mexican American Indians | 0.0 /100 | #331 | Tragic 89.0% |
| Immigrants | Azores | 0.0 /100 | #332 | Tragic 89.0% |
| Hondurans | 0.0 /100 | #333 | Tragic 89.0% |
| Hispanics or Latinos | 0.0 /100 | #334 | Tragic 88.9% |
| Immigrants | Dominican Republic | 0.0 /100 | #335 | Tragic 88.7% |
| Immigrants | Honduras | 0.0 /100 | #336 | Tragic 88.5% |
| Central Americans | 0.0 /100 | #337 | Tragic 88.4% |
| Immigrants | Latin America | 0.0 /100 | #338 | Tragic 88.3% |
| Guatemalans | 0.0 /100 | #339 | Tragic 87.9% |
| Mexicans | 0.0 /100 | #340 | Tragic 87.8% |
| Salvadorans | 0.0 /100 | #341 | Tragic 87.5% |