Immigrants from Nicaragua vs Swedish Master's Degree
COMPARE
Immigrants from Nicaragua
Swedish
Master's Degree
Master's Degree Comparison
Immigrants from Nicaragua
Swedes
11.8%
MASTER'S DEGREE
0.2/ 100
METRIC RATING
285th/ 347
METRIC RANK
15.2%
MASTER'S DEGREE
66.1/ 100
METRIC RATING
166th/ 347
METRIC RANK
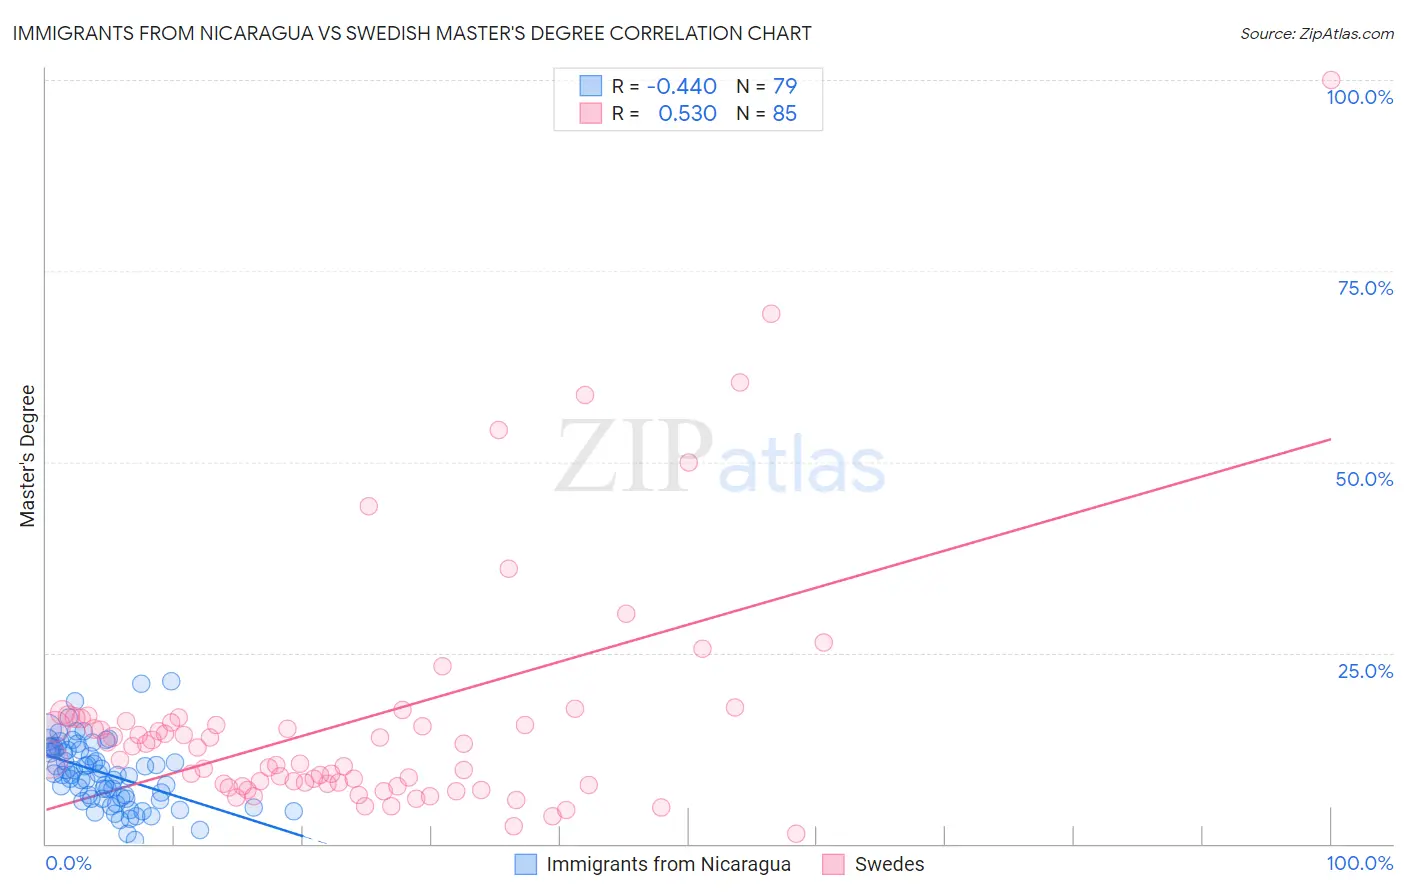
Immigrants from Nicaragua vs Swedish Master's Degree Correlation Chart
The statistical analysis conducted on geographies consisting of 236,327,248 people shows a moderate negative correlation between the proportion of Immigrants from Nicaragua and percentage of population with at least master's degree education in the United States with a correlation coefficient (R) of -0.440 and weighted average of 11.8%. Similarly, the statistical analysis conducted on geographies consisting of 538,720,356 people shows a substantial positive correlation between the proportion of Swedes and percentage of population with at least master's degree education in the United States with a correlation coefficient (R) of 0.530 and weighted average of 15.2%, a difference of 28.7%.
Master's Degree Correlation Summary
| Measurement | Immigrants from Nicaragua | Swedish |
| Minimum | 0.53% | 1.3% |
| Maximum | 21.2% | 100.0% |
| Range | 20.7% | 98.7% |
| Mean | 9.2% | 16.0% |
| Median | 9.1% | 12.6% |
| Interquartile 25% (IQ1) | 6.0% | 7.7% |
| Interquartile 75% (IQ3) | 12.4% | 16.2% |
| Interquartile Range (IQR) | 6.4% | 8.5% |
| Standard Deviation (Sample) | 4.3% | 15.9% |
| Standard Deviation (Population) | 4.3% | 15.8% |
Similar Demographics by Master's Degree
Demographics Similar to Immigrants from Nicaragua by Master's Degree
In terms of master's degree, the demographic groups most similar to Immigrants from Nicaragua are Ottawa (11.9%, a difference of 0.18%), Aleut (11.8%, a difference of 0.35%), Immigrants from Haiti (11.8%, a difference of 0.55%), Immigrants from Honduras (11.8%, a difference of 0.72%), and Guatemalan (11.7%, a difference of 0.80%).
| Demographics | Rating | Rank | Master's Degree |
| Potawatomi | 0.3 /100 | #278 | Tragic 12.1% |
| Immigrants | Belize | 0.2 /100 | #279 | Tragic 12.1% |
| Immigrants | Dominican Republic | 0.2 /100 | #280 | Tragic 12.1% |
| Malaysians | 0.2 /100 | #281 | Tragic 12.0% |
| Immigrants | El Salvador | 0.2 /100 | #282 | Tragic 12.0% |
| Hondurans | 0.2 /100 | #283 | Tragic 11.9% |
| Ottawa | 0.2 /100 | #284 | Tragic 11.9% |
| Immigrants | Nicaragua | 0.2 /100 | #285 | Tragic 11.8% |
| Aleuts | 0.1 /100 | #286 | Tragic 11.8% |
| Immigrants | Haiti | 0.1 /100 | #287 | Tragic 11.8% |
| Immigrants | Honduras | 0.1 /100 | #288 | Tragic 11.8% |
| Guatemalans | 0.1 /100 | #289 | Tragic 11.7% |
| Ute | 0.1 /100 | #290 | Tragic 11.7% |
| Colville | 0.1 /100 | #291 | Tragic 11.6% |
| Immigrants | Guatemala | 0.1 /100 | #292 | Tragic 11.6% |
Demographics Similar to Swedes by Master's Degree
In terms of master's degree, the demographic groups most similar to Swedes are Immigrants from Kenya (15.3%, a difference of 0.070%), Senegalese (15.2%, a difference of 0.070%), Colombian (15.3%, a difference of 0.11%), Uruguayan (15.3%, a difference of 0.14%), and Immigrants from North Macedonia (15.2%, a difference of 0.22%).
| Demographics | Rating | Rank | Master's Degree |
| Luxembourgers | 71.0 /100 | #159 | Good 15.3% |
| Kenyans | 70.3 /100 | #160 | Good 15.3% |
| Sudanese | 68.7 /100 | #161 | Good 15.3% |
| Peruvians | 68.7 /100 | #162 | Good 15.3% |
| Uruguayans | 67.1 /100 | #163 | Good 15.3% |
| Colombians | 66.9 /100 | #164 | Good 15.3% |
| Immigrants | Kenya | 66.6 /100 | #165 | Good 15.3% |
| Swedes | 66.1 /100 | #166 | Good 15.2% |
| Senegalese | 65.6 /100 | #167 | Good 15.2% |
| Immigrants | North Macedonia | 64.5 /100 | #168 | Good 15.2% |
| Scottish | 62.7 /100 | #169 | Good 15.2% |
| Irish | 56.3 /100 | #170 | Average 15.0% |
| Immigrants | Ghana | 53.6 /100 | #171 | Average 15.0% |
| Immigrants | Uruguay | 52.8 /100 | #172 | Average 15.0% |
| Costa Ricans | 52.5 /100 | #173 | Average 15.0% |