Greek vs Swedish In Labor Force | Age 16-19
COMPARE
Greek
Swedish
In Labor Force | Age 16-19
In Labor Force | Age 16-19 Comparison
Greeks
Swedes
38.9%
IN LABOR FORCE | AGE 16-19
99.3/ 100
METRIC RATING
97th/ 347
METRIC RANK
44.1%
IN LABOR FORCE | AGE 16-19
100.0/ 100
METRIC RATING
11th/ 347
METRIC RANK
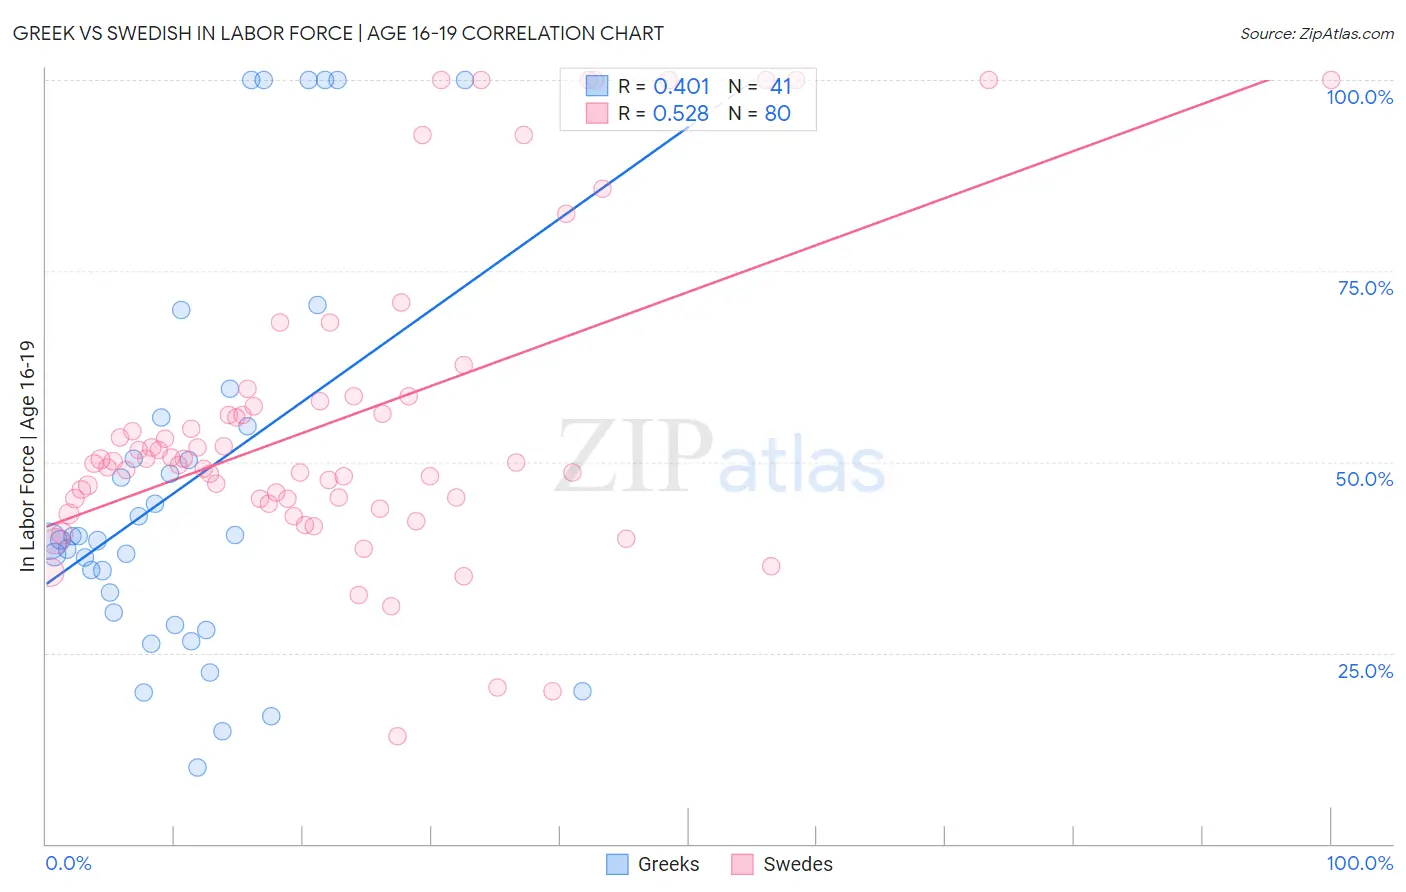
Greek vs Swedish In Labor Force | Age 16-19 Correlation Chart
The statistical analysis conducted on geographies consisting of 481,502,994 people shows a moderate positive correlation between the proportion of Greeks and labor force participation rate among population between the ages 16 and 19 in the United States with a correlation coefficient (R) of 0.401 and weighted average of 38.9%. Similarly, the statistical analysis conducted on geographies consisting of 536,421,636 people shows a substantial positive correlation between the proportion of Swedes and labor force participation rate among population between the ages 16 and 19 in the United States with a correlation coefficient (R) of 0.528 and weighted average of 44.1%, a difference of 13.5%.
In Labor Force | Age 16-19 Correlation Summary
| Measurement | Greek | Swedish |
| Minimum | 10.0% | 14.1% |
| Maximum | 100.0% | 100.0% |
| Range | 90.0% | 85.9% |
| Mean | 47.2% | 55.6% |
| Median | 39.8% | 50.0% |
| Interquartile 25% (IQ1) | 29.5% | 45.2% |
| Interquartile 75% (IQ3) | 55.3% | 58.3% |
| Interquartile Range (IQR) | 25.8% | 13.1% |
| Standard Deviation (Sample) | 25.8% | 20.5% |
| Standard Deviation (Population) | 25.5% | 20.3% |
Similar Demographics by In Labor Force | Age 16-19
Demographics Similar to Greeks by In Labor Force | Age 16-19
In terms of in labor force | age 16-19, the demographic groups most similar to Greeks are Ugandan (38.9%, a difference of 0.010%), Immigrants from North Macedonia (38.9%, a difference of 0.030%), Latvian (38.9%, a difference of 0.040%), Immigrants from North America (38.9%, a difference of 0.070%), and Blackfeet (38.9%, a difference of 0.16%).
| Demographics | Rating | Rank | In Labor Force | Age 16-19 |
| Immigrants | Burma/Myanmar | 99.5 /100 | #90 | Exceptional 39.0% |
| Spanish Americans | 99.5 /100 | #91 | Exceptional 39.0% |
| Osage | 99.4 /100 | #92 | Exceptional 39.0% |
| Blackfeet | 99.4 /100 | #93 | Exceptional 38.9% |
| Immigrants | Canada | 99.4 /100 | #94 | Exceptional 38.9% |
| Immigrants | North America | 99.4 /100 | #95 | Exceptional 38.9% |
| Latvians | 99.4 /100 | #96 | Exceptional 38.9% |
| Greeks | 99.3 /100 | #97 | Exceptional 38.9% |
| Ugandans | 99.3 /100 | #98 | Exceptional 38.9% |
| Immigrants | North Macedonia | 99.3 /100 | #99 | Exceptional 38.9% |
| Immigrants | Thailand | 99.1 /100 | #100 | Exceptional 38.7% |
| Hmong | 99.1 /100 | #101 | Exceptional 38.7% |
| Zimbabweans | 99.1 /100 | #102 | Exceptional 38.7% |
| Immigrants | Cameroon | 99.0 /100 | #103 | Exceptional 38.7% |
| Immigrants | Eritrea | 99.0 /100 | #104 | Exceptional 38.7% |
Demographics Similar to Swedes by In Labor Force | Age 16-19
In terms of in labor force | age 16-19, the demographic groups most similar to Swedes are German (44.2%, a difference of 0.080%), Finnish (43.9%, a difference of 0.46%), Dutch (43.8%, a difference of 0.64%), Chippewa (43.8%, a difference of 0.75%), and Cape Verdean (44.5%, a difference of 0.82%).
| Demographics | Rating | Rank | In Labor Force | Age 16-19 |
| Luxembourgers | 100.0 /100 | #4 | Exceptional 45.3% |
| Alaskan Athabascans | 100.0 /100 | #5 | Exceptional 45.2% |
| Somalis | 100.0 /100 | #6 | Exceptional 45.1% |
| Danes | 100.0 /100 | #7 | Exceptional 44.7% |
| Immigrants | Cabo Verde | 100.0 /100 | #8 | Exceptional 44.7% |
| Cape Verdeans | 100.0 /100 | #9 | Exceptional 44.5% |
| Germans | 100.0 /100 | #10 | Exceptional 44.2% |
| Swedes | 100.0 /100 | #11 | Exceptional 44.1% |
| Finns | 100.0 /100 | #12 | Exceptional 43.9% |
| Dutch | 100.0 /100 | #13 | Exceptional 43.8% |
| Chippewa | 100.0 /100 | #14 | Exceptional 43.8% |
| Slovenes | 100.0 /100 | #15 | Exceptional 43.7% |
| Czechs | 100.0 /100 | #16 | Exceptional 43.6% |
| Scandinavians | 100.0 /100 | #17 | Exceptional 43.6% |
| French Canadians | 100.0 /100 | #18 | Exceptional 43.6% |