Greek vs Portuguese Unemployment Among Ages 30 to 34 years
COMPARE
Greek
Portuguese
Unemployment Among Ages 30 to 34 years
Unemployment Among Ages 30 to 34 years Comparison
Greeks
Portuguese
5.3%
UNEMPLOYMENT AMONG AGES 30 TO 34 YEARS
80.4/ 100
METRIC RATING
125th/ 347
METRIC RANK
5.9%
UNEMPLOYMENT AMONG AGES 30 TO 34 YEARS
0.8/ 100
METRIC RATING
234th/ 347
METRIC RANK
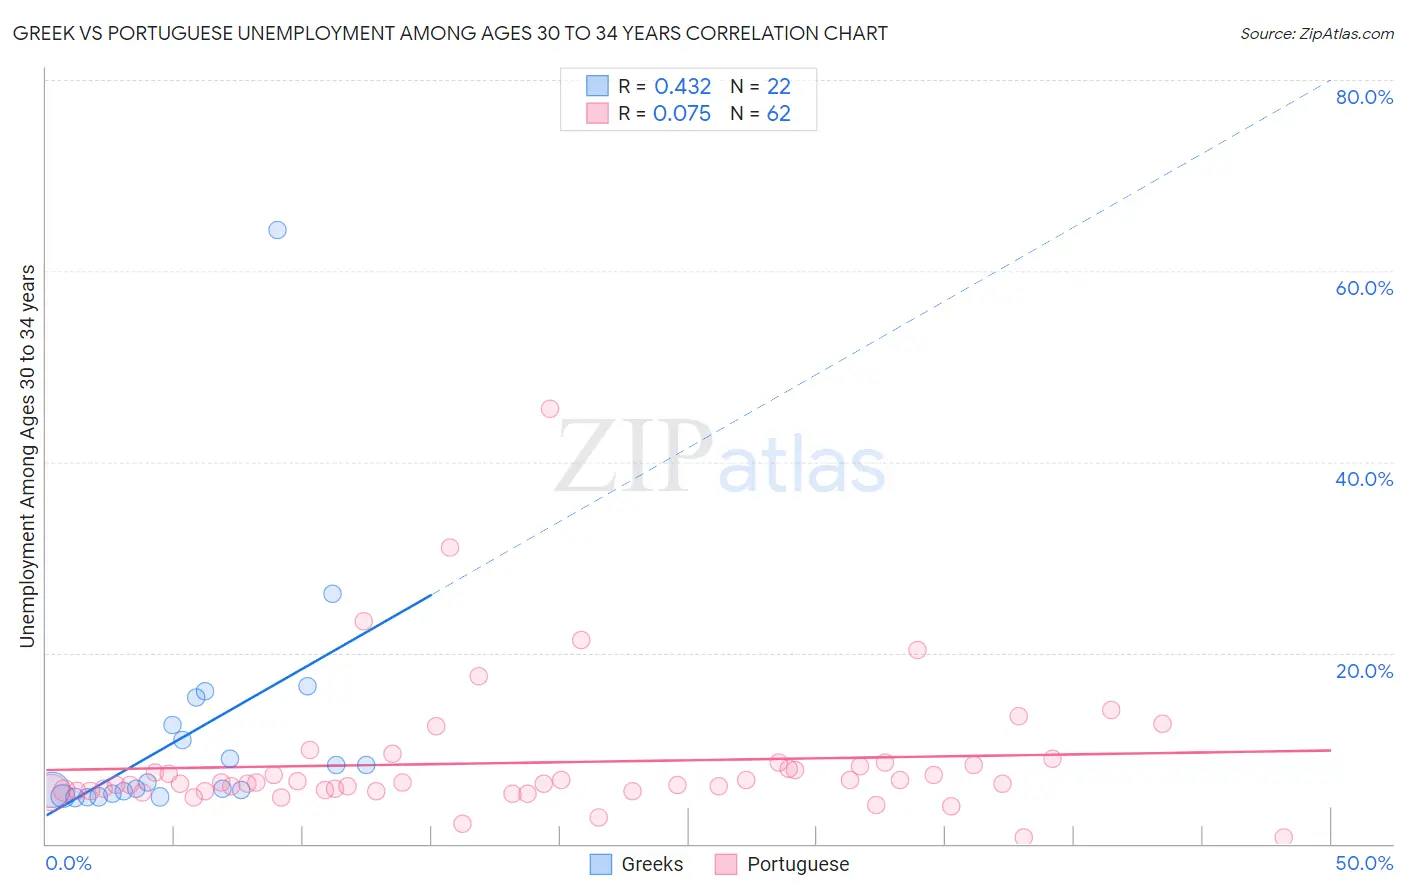
Greek vs Portuguese Unemployment Among Ages 30 to 34 years Correlation Chart
The statistical analysis conducted on geographies consisting of 442,229,062 people shows a moderate positive correlation between the proportion of Greeks and unemployment rate among population between the ages 30 and 34 in the United States with a correlation coefficient (R) of 0.432 and weighted average of 5.3%. Similarly, the statistical analysis conducted on geographies consisting of 416,195,199 people shows a slight positive correlation between the proportion of Portuguese and unemployment rate among population between the ages 30 and 34 in the United States with a correlation coefficient (R) of 0.075 and weighted average of 5.9%, a difference of 11.1%.
Unemployment Among Ages 30 to 34 years Correlation Summary
| Measurement | Greek | Portuguese |
| Minimum | 4.9% | 0.60% |
| Maximum | 64.3% | 45.5% |
| Range | 59.5% | 44.9% |
| Mean | 11.4% | 8.5% |
| Median | 6.1% | 6.3% |
| Interquartile 25% (IQ1) | 5.3% | 5.6% |
| Interquartile 75% (IQ3) | 12.5% | 8.3% |
| Interquartile Range (IQR) | 7.2% | 2.7% |
| Standard Deviation (Sample) | 13.0% | 7.1% |
| Standard Deviation (Population) | 12.7% | 7.0% |
Similar Demographics by Unemployment Among Ages 30 to 34 years
Demographics Similar to Greeks by Unemployment Among Ages 30 to 34 years
In terms of unemployment among ages 30 to 34 years, the demographic groups most similar to Greeks are Immigrants from Sri Lanka (5.3%, a difference of 0.020%), Immigrants from Brazil (5.3%, a difference of 0.050%), Immigrants from Italy (5.3%, a difference of 0.080%), Taiwanese (5.3%, a difference of 0.11%), and Immigrants from Uruguay (5.3%, a difference of 0.12%).
| Demographics | Rating | Rank | Unemployment Among Ages 30 to 34 years |
| Immigrants | South Africa | 83.0 /100 | #118 | Excellent 5.3% |
| New Zealanders | 82.5 /100 | #119 | Excellent 5.3% |
| Immigrants | Poland | 82.4 /100 | #120 | Excellent 5.3% |
| Romanians | 82.3 /100 | #121 | Excellent 5.3% |
| Immigrants | Netherlands | 81.8 /100 | #122 | Excellent 5.3% |
| Immigrants | Italy | 81.1 /100 | #123 | Excellent 5.3% |
| Immigrants | Brazil | 80.8 /100 | #124 | Excellent 5.3% |
| Greeks | 80.4 /100 | #125 | Excellent 5.3% |
| Immigrants | Sri Lanka | 80.2 /100 | #126 | Excellent 5.3% |
| Taiwanese | 79.4 /100 | #127 | Good 5.3% |
| Immigrants | Uruguay | 79.3 /100 | #128 | Good 5.3% |
| Poles | 78.8 /100 | #129 | Good 5.3% |
| Germans | 77.8 /100 | #130 | Good 5.3% |
| Immigrants | Eastern Europe | 77.4 /100 | #131 | Good 5.3% |
| Carpatho Rusyns | 77.3 /100 | #132 | Good 5.3% |
Demographics Similar to Portuguese by Unemployment Among Ages 30 to 34 years
In terms of unemployment among ages 30 to 34 years, the demographic groups most similar to Portuguese are Nepalese (5.9%, a difference of 0.030%), Yaqui (5.9%, a difference of 0.12%), Native Hawaiian (5.9%, a difference of 0.24%), Iroquois (5.9%, a difference of 0.41%), and Central American (5.9%, a difference of 0.41%).
| Demographics | Rating | Rank | Unemployment Among Ages 30 to 34 years |
| Spanish | 1.8 /100 | #227 | Tragic 5.8% |
| Immigrants | Bahamas | 1.8 /100 | #228 | Tragic 5.8% |
| Immigrants | Uzbekistan | 1.5 /100 | #229 | Tragic 5.9% |
| Hawaiians | 1.2 /100 | #230 | Tragic 5.9% |
| Japanese | 1.1 /100 | #231 | Tragic 5.9% |
| Iroquois | 1.0 /100 | #232 | Tragic 5.9% |
| Nepalese | 0.8 /100 | #233 | Tragic 5.9% |
| Portuguese | 0.8 /100 | #234 | Tragic 5.9% |
| Yaqui | 0.7 /100 | #235 | Tragic 5.9% |
| Native Hawaiians | 0.7 /100 | #236 | Tragic 5.9% |
| Central Americans | 0.6 /100 | #237 | Tragic 5.9% |
| Mexican American Indians | 0.6 /100 | #238 | Tragic 5.9% |
| Immigrants | Nigeria | 0.6 /100 | #239 | Tragic 6.0% |
| Salvadorans | 0.5 /100 | #240 | Tragic 6.0% |
| Immigrants | El Salvador | 0.5 /100 | #241 | Tragic 6.0% |