Greek vs Portuguese Nursery School
COMPARE
Greek
Portuguese
Nursery School
Nursery School Comparison
Greeks
Portuguese
98.4%
NURSERY SCHOOL
99.7/ 100
METRIC RATING
64th/ 347
METRIC RANK
98.0%
NURSERY SCHOOL
41.8/ 100
METRIC RATING
183rd/ 347
METRIC RANK
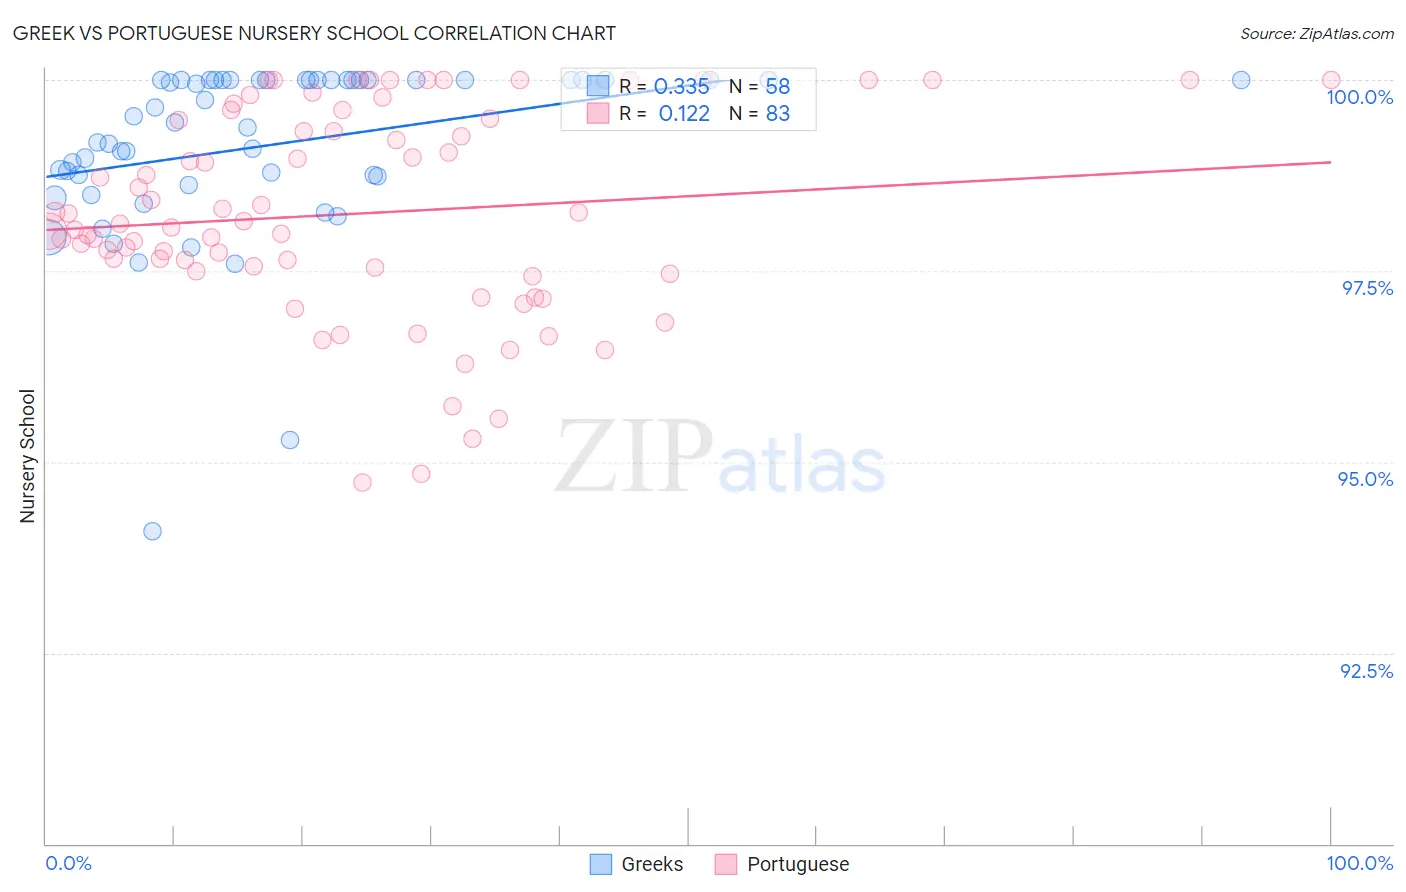
Greek vs Portuguese Nursery School Correlation Chart
The statistical analysis conducted on geographies consisting of 482,775,358 people shows a mild positive correlation between the proportion of Greeks and percentage of population with at least nursery school education in the United States with a correlation coefficient (R) of 0.335 and weighted average of 98.4%. Similarly, the statistical analysis conducted on geographies consisting of 450,368,110 people shows a poor positive correlation between the proportion of Portuguese and percentage of population with at least nursery school education in the United States with a correlation coefficient (R) of 0.122 and weighted average of 98.0%, a difference of 0.47%.
Nursery School Correlation Summary
| Measurement | Greek | Portuguese |
| Minimum | 94.1% | 94.7% |
| Maximum | 100.0% | 100.0% |
| Range | 5.9% | 5.3% |
| Mean | 99.1% | 98.2% |
| Median | 99.5% | 98.1% |
| Interquartile 25% (IQ1) | 98.7% | 97.5% |
| Interquartile 75% (IQ3) | 100.0% | 99.5% |
| Interquartile Range (IQR) | 1.3% | 2.0% |
| Standard Deviation (Sample) | 1.1% | 1.3% |
| Standard Deviation (Population) | 1.1% | 1.3% |
Similar Demographics by Nursery School
Demographics Similar to Greeks by Nursery School
In terms of nursery school, the demographic groups most similar to Greeks are New Zealander (98.4%, a difference of 0.0%), Creek (98.4%, a difference of 0.0%), Immigrants from North America (98.4%, a difference of 0.0%), Maltese (98.4%, a difference of 0.0%), and Austrian (98.4%, a difference of 0.010%).
| Demographics | Rating | Rank | Nursery School |
| Austrians | 99.8 /100 | #57 | Exceptional 98.4% |
| Bulgarians | 99.8 /100 | #58 | Exceptional 98.4% |
| Immigrants | Canada | 99.8 /100 | #59 | Exceptional 98.4% |
| Slavs | 99.8 /100 | #60 | Exceptional 98.4% |
| New Zealanders | 99.7 /100 | #61 | Exceptional 98.4% |
| Creek | 99.7 /100 | #62 | Exceptional 98.4% |
| Immigrants | North America | 99.7 /100 | #63 | Exceptional 98.4% |
| Greeks | 99.7 /100 | #64 | Exceptional 98.4% |
| Maltese | 99.7 /100 | #65 | Exceptional 98.4% |
| Canadians | 99.7 /100 | #66 | Exceptional 98.4% |
| Immigrants | Northern Europe | 99.6 /100 | #67 | Exceptional 98.4% |
| Russians | 99.6 /100 | #68 | Exceptional 98.4% |
| Immigrants | Austria | 99.6 /100 | #69 | Exceptional 98.4% |
| Cheyenne | 99.6 /100 | #70 | Exceptional 98.4% |
| Serbians | 99.6 /100 | #71 | Exceptional 98.4% |
Demographics Similar to Portuguese by Nursery School
In terms of nursery school, the demographic groups most similar to Portuguese are Egyptian (98.0%, a difference of 0.0%), Paiute (98.0%, a difference of 0.0%), Immigrants from Poland (98.0%, a difference of 0.0%), Immigrants from Belarus (98.0%, a difference of 0.0%), and Immigrants from Argentina (98.0%, a difference of 0.0%).
| Demographics | Rating | Rank | Nursery School |
| Immigrants | Venezuela | 49.8 /100 | #176 | Average 98.0% |
| Albanians | 48.9 /100 | #177 | Average 98.0% |
| Natives/Alaskans | 48.6 /100 | #178 | Average 98.0% |
| Argentineans | 46.8 /100 | #179 | Average 98.0% |
| Immigrants | Bosnia and Herzegovina | 45.6 /100 | #180 | Average 98.0% |
| Egyptians | 42.8 /100 | #181 | Average 98.0% |
| Paiute | 42.0 /100 | #182 | Average 98.0% |
| Portuguese | 41.8 /100 | #183 | Average 98.0% |
| Immigrants | Poland | 41.3 /100 | #184 | Average 98.0% |
| Immigrants | Belarus | 41.0 /100 | #185 | Average 98.0% |
| Immigrants | Argentina | 40.8 /100 | #186 | Average 98.0% |
| Immigrants | Kazakhstan | 37.1 /100 | #187 | Fair 97.9% |
| Arabs | 34.7 /100 | #188 | Fair 97.9% |
| Pakistanis | 34.6 /100 | #189 | Fair 97.9% |
| Panamanians | 34.3 /100 | #190 | Fair 97.9% |