Ghanaian vs Immigrants from the Azores 11th Grade
COMPARE
Ghanaian
Immigrants from the Azores
11th Grade
11th Grade Comparison
Ghanaians
Immigrants from the Azores
91.5%
11TH GRADE
0.9/ 100
METRIC RATING
250th/ 347
METRIC RANK
87.2%
11TH GRADE
0.0/ 100
METRIC RATING
332nd/ 347
METRIC RANK
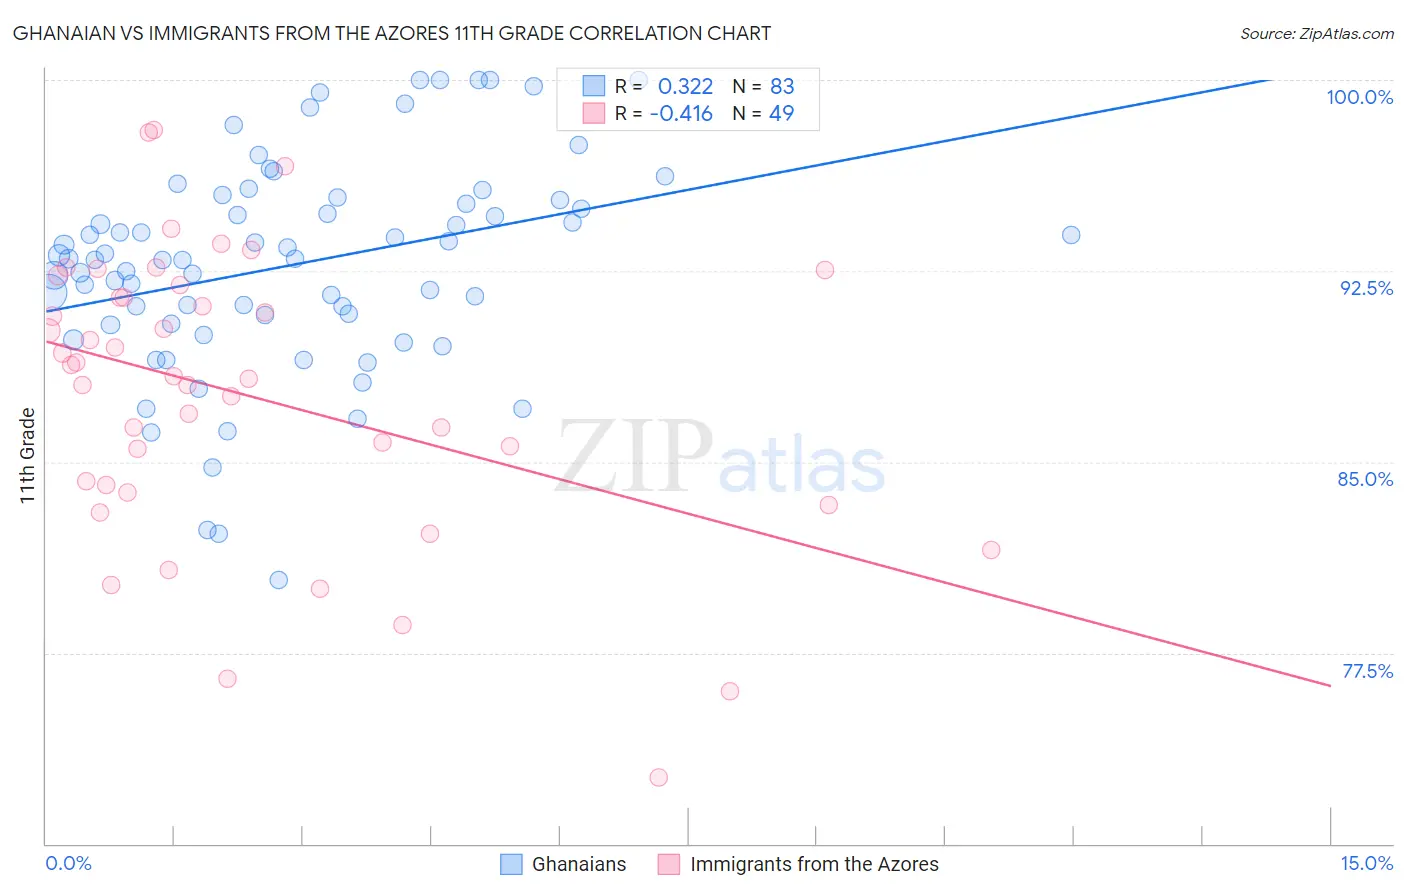
Ghanaian vs Immigrants from the Azores 11th Grade Correlation Chart
The statistical analysis conducted on geographies consisting of 190,714,079 people shows a mild positive correlation between the proportion of Ghanaians and percentage of population with at least 11th grade education in the United States with a correlation coefficient (R) of 0.322 and weighted average of 91.5%. Similarly, the statistical analysis conducted on geographies consisting of 46,257,310 people shows a moderate negative correlation between the proportion of Immigrants from the Azores and percentage of population with at least 11th grade education in the United States with a correlation coefficient (R) of -0.416 and weighted average of 87.2%, a difference of 4.9%.
11th Grade Correlation Summary
| Measurement | Ghanaian | Immigrants from the Azores |
| Minimum | 80.3% | 72.6% |
| Maximum | 100.0% | 98.0% |
| Range | 19.7% | 25.4% |
| Mean | 92.7% | 87.6% |
| Median | 93.0% | 88.3% |
| Interquartile 25% (IQ1) | 90.4% | 83.9% |
| Interquartile 75% (IQ3) | 95.3% | 91.7% |
| Interquartile Range (IQR) | 4.9% | 7.8% |
| Standard Deviation (Sample) | 4.2% | 5.6% |
| Standard Deviation (Population) | 4.2% | 5.6% |
Similar Demographics by 11th Grade
Demographics Similar to Ghanaians by 11th Grade
In terms of 11th grade, the demographic groups most similar to Ghanaians are Peruvian (91.5%, a difference of 0.0%), Immigrants from Philippines (91.5%, a difference of 0.010%), Immigrants from Uzbekistan (91.5%, a difference of 0.010%), Immigrants from Costa Rica (91.4%, a difference of 0.020%), and Immigrants from Nigeria (91.4%, a difference of 0.030%).
| Demographics | Rating | Rank | 11th Grade |
| Immigrants | Thailand | 1.4 /100 | #243 | Tragic 91.6% |
| Senegalese | 1.4 /100 | #244 | Tragic 91.6% |
| Africans | 1.3 /100 | #245 | Tragic 91.5% |
| Seminole | 1.2 /100 | #246 | Tragic 91.5% |
| Immigrants | Philippines | 1.0 /100 | #247 | Tragic 91.5% |
| Immigrants | Uzbekistan | 1.0 /100 | #248 | Tragic 91.5% |
| Peruvians | 1.0 /100 | #249 | Tragic 91.5% |
| Ghanaians | 0.9 /100 | #250 | Tragic 91.5% |
| Immigrants | Costa Rica | 0.9 /100 | #251 | Tragic 91.4% |
| Immigrants | Nigeria | 0.8 /100 | #252 | Tragic 91.4% |
| Immigrants | South America | 0.8 /100 | #253 | Tragic 91.4% |
| Immigrants | Eritrea | 0.7 /100 | #254 | Tragic 91.4% |
| Blacks/African Americans | 0.7 /100 | #255 | Tragic 91.4% |
| Immigrants | Senegal | 0.7 /100 | #256 | Tragic 91.4% |
| Cajuns | 0.7 /100 | #257 | Tragic 91.4% |
Demographics Similar to Immigrants from the Azores by 11th Grade
In terms of 11th grade, the demographic groups most similar to Immigrants from the Azores are Hispanic or Latino (87.3%, a difference of 0.090%), Honduran (87.4%, a difference of 0.16%), Immigrants from Yemen (87.1%, a difference of 0.17%), Houma (87.0%, a difference of 0.24%), and Central American (86.9%, a difference of 0.33%).
| Demographics | Rating | Rank | 11th Grade |
| Immigrants | Nicaragua | 0.0 /100 | #325 | Tragic 88.1% |
| Dominicans | 0.0 /100 | #326 | Tragic 87.7% |
| Immigrants | Cabo Verde | 0.0 /100 | #327 | Tragic 87.6% |
| Tohono O'odham | 0.0 /100 | #328 | Tragic 87.6% |
| Mexican American Indians | 0.0 /100 | #329 | Tragic 87.5% |
| Hondurans | 0.0 /100 | #330 | Tragic 87.4% |
| Hispanics or Latinos | 0.0 /100 | #331 | Tragic 87.3% |
| Immigrants | Azores | 0.0 /100 | #332 | Tragic 87.2% |
| Immigrants | Yemen | 0.0 /100 | #333 | Tragic 87.1% |
| Houma | 0.0 /100 | #334 | Tragic 87.0% |
| Central Americans | 0.0 /100 | #335 | Tragic 86.9% |
| Immigrants | Dominican Republic | 0.0 /100 | #336 | Tragic 86.9% |
| Immigrants | Honduras | 0.0 /100 | #337 | Tragic 86.9% |
| Immigrants | Latin America | 0.0 /100 | #338 | Tragic 86.8% |
| Guatemalans | 0.0 /100 | #339 | Tragic 86.4% |