Ghanaian vs Immigrants from Eastern Africa 11th Grade
COMPARE
Ghanaian
Immigrants from Eastern Africa
11th Grade
11th Grade Comparison
Ghanaians
Immigrants from Eastern Africa
91.5%
11TH GRADE
0.9/ 100
METRIC RATING
250th/ 347
METRIC RANK
92.3%
11TH GRADE
24.1/ 100
METRIC RATING
202nd/ 347
METRIC RANK
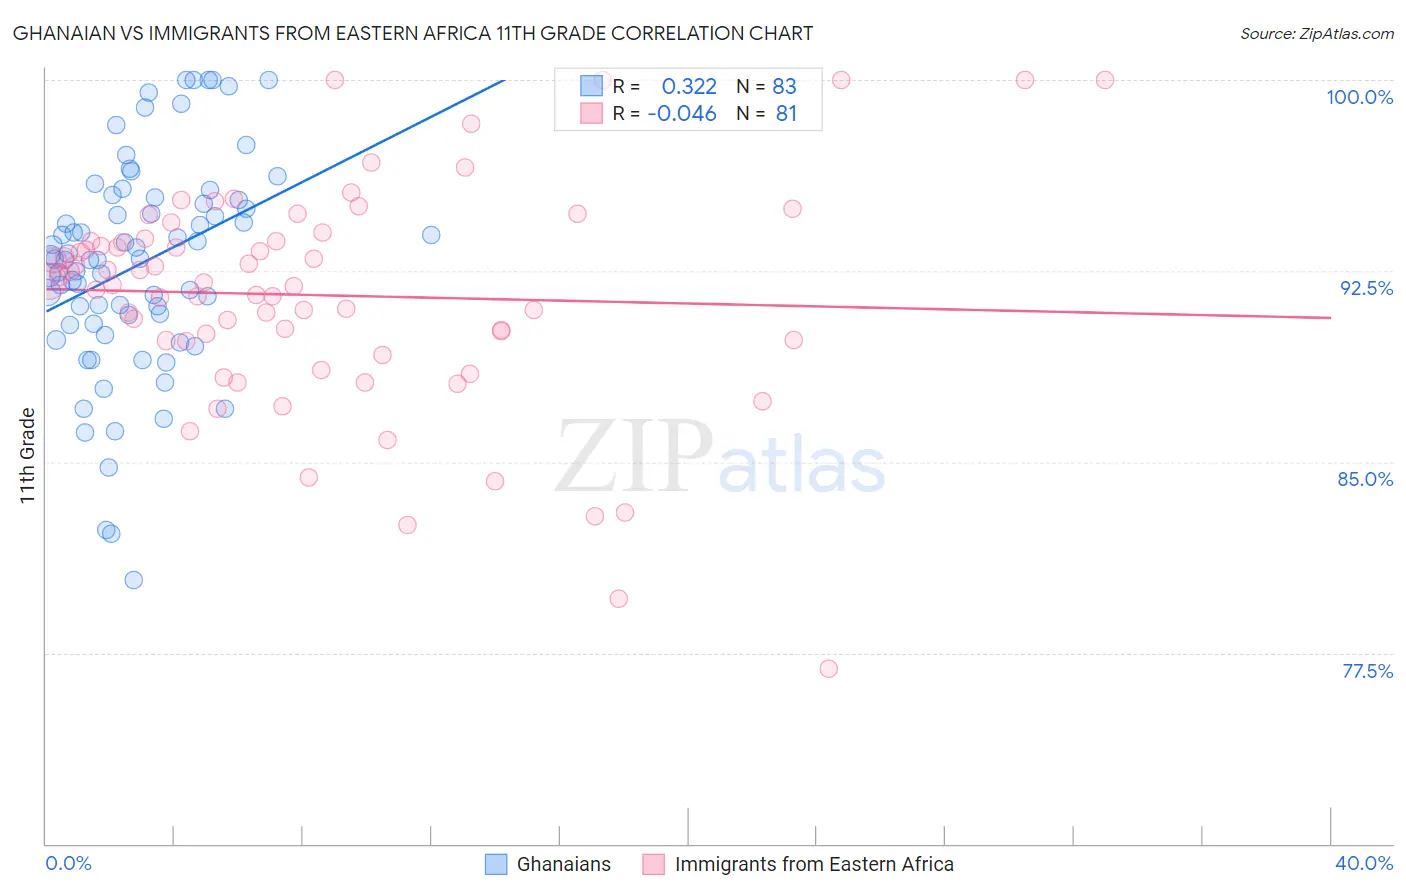
Ghanaian vs Immigrants from Eastern Africa 11th Grade Correlation Chart
The statistical analysis conducted on geographies consisting of 190,714,079 people shows a mild positive correlation between the proportion of Ghanaians and percentage of population with at least 11th grade education in the United States with a correlation coefficient (R) of 0.322 and weighted average of 91.5%. Similarly, the statistical analysis conducted on geographies consisting of 355,144,184 people shows no correlation between the proportion of Immigrants from Eastern Africa and percentage of population with at least 11th grade education in the United States with a correlation coefficient (R) of -0.046 and weighted average of 92.3%, a difference of 0.87%.
11th Grade Correlation Summary
| Measurement | Ghanaian | Immigrants from Eastern Africa |
| Minimum | 80.3% | 76.9% |
| Maximum | 100.0% | 100.0% |
| Range | 19.7% | 23.1% |
| Mean | 92.7% | 91.5% |
| Median | 93.0% | 92.1% |
| Interquartile 25% (IQ1) | 90.4% | 89.7% |
| Interquartile 75% (IQ3) | 95.3% | 93.7% |
| Interquartile Range (IQR) | 4.9% | 4.0% |
| Standard Deviation (Sample) | 4.2% | 4.4% |
| Standard Deviation (Population) | 4.2% | 4.4% |
Similar Demographics by 11th Grade
Demographics Similar to Ghanaians by 11th Grade
In terms of 11th grade, the demographic groups most similar to Ghanaians are Peruvian (91.5%, a difference of 0.0%), Immigrants from Philippines (91.5%, a difference of 0.010%), Immigrants from Uzbekistan (91.5%, a difference of 0.010%), Immigrants from Costa Rica (91.4%, a difference of 0.020%), and Immigrants from Nigeria (91.4%, a difference of 0.030%).
| Demographics | Rating | Rank | 11th Grade |
| Immigrants | Thailand | 1.4 /100 | #243 | Tragic 91.6% |
| Senegalese | 1.4 /100 | #244 | Tragic 91.6% |
| Africans | 1.3 /100 | #245 | Tragic 91.5% |
| Seminole | 1.2 /100 | #246 | Tragic 91.5% |
| Immigrants | Philippines | 1.0 /100 | #247 | Tragic 91.5% |
| Immigrants | Uzbekistan | 1.0 /100 | #248 | Tragic 91.5% |
| Peruvians | 1.0 /100 | #249 | Tragic 91.5% |
| Ghanaians | 0.9 /100 | #250 | Tragic 91.5% |
| Immigrants | Costa Rica | 0.9 /100 | #251 | Tragic 91.4% |
| Immigrants | Nigeria | 0.8 /100 | #252 | Tragic 91.4% |
| Immigrants | South America | 0.8 /100 | #253 | Tragic 91.4% |
| Immigrants | Eritrea | 0.7 /100 | #254 | Tragic 91.4% |
| Blacks/African Americans | 0.7 /100 | #255 | Tragic 91.4% |
| Immigrants | Senegal | 0.7 /100 | #256 | Tragic 91.4% |
| Cajuns | 0.7 /100 | #257 | Tragic 91.4% |
Demographics Similar to Immigrants from Eastern Africa by 11th Grade
In terms of 11th grade, the demographic groups most similar to Immigrants from Eastern Africa are Samoan (92.3%, a difference of 0.010%), Immigrants from China (92.3%, a difference of 0.010%), Immigrants from Sudan (92.3%, a difference of 0.010%), Immigrants from Hong Kong (92.2%, a difference of 0.010%), and Kiowa (92.2%, a difference of 0.010%).
| Demographics | Rating | Rank | 11th Grade |
| Liberians | 26.8 /100 | #195 | Fair 92.3% |
| Panamanians | 26.4 /100 | #196 | Fair 92.3% |
| Marshallese | 26.0 /100 | #197 | Fair 92.3% |
| Hawaiians | 25.5 /100 | #198 | Fair 92.3% |
| Immigrants | Uganda | 25.2 /100 | #199 | Fair 92.3% |
| Samoans | 25.1 /100 | #200 | Fair 92.3% |
| Immigrants | China | 25.1 /100 | #201 | Fair 92.3% |
| Immigrants | Eastern Africa | 24.1 /100 | #202 | Fair 92.3% |
| Immigrants | Sudan | 23.5 /100 | #203 | Fair 92.3% |
| Immigrants | Hong Kong | 23.3 /100 | #204 | Fair 92.2% |
| Kiowa | 23.2 /100 | #205 | Fair 92.2% |
| Bolivians | 23.2 /100 | #206 | Fair 92.2% |
| Immigrants | Oceania | 22.4 /100 | #207 | Fair 92.2% |
| Colville | 21.8 /100 | #208 | Fair 92.2% |
| Tongans | 19.8 /100 | #209 | Poor 92.2% |