Ghanaian vs Immigrants from Belarus Doctorate Degree
COMPARE
Ghanaian
Immigrants from Belarus
Doctorate Degree
Doctorate Degree Comparison
Ghanaians
Immigrants from Belarus
1.8%
DOCTORATE DEGREE
48.3/ 100
METRIC RATING
179th/ 347
METRIC RANK
2.2%
DOCTORATE DEGREE
99.7/ 100
METRIC RATING
78th/ 347
METRIC RANK
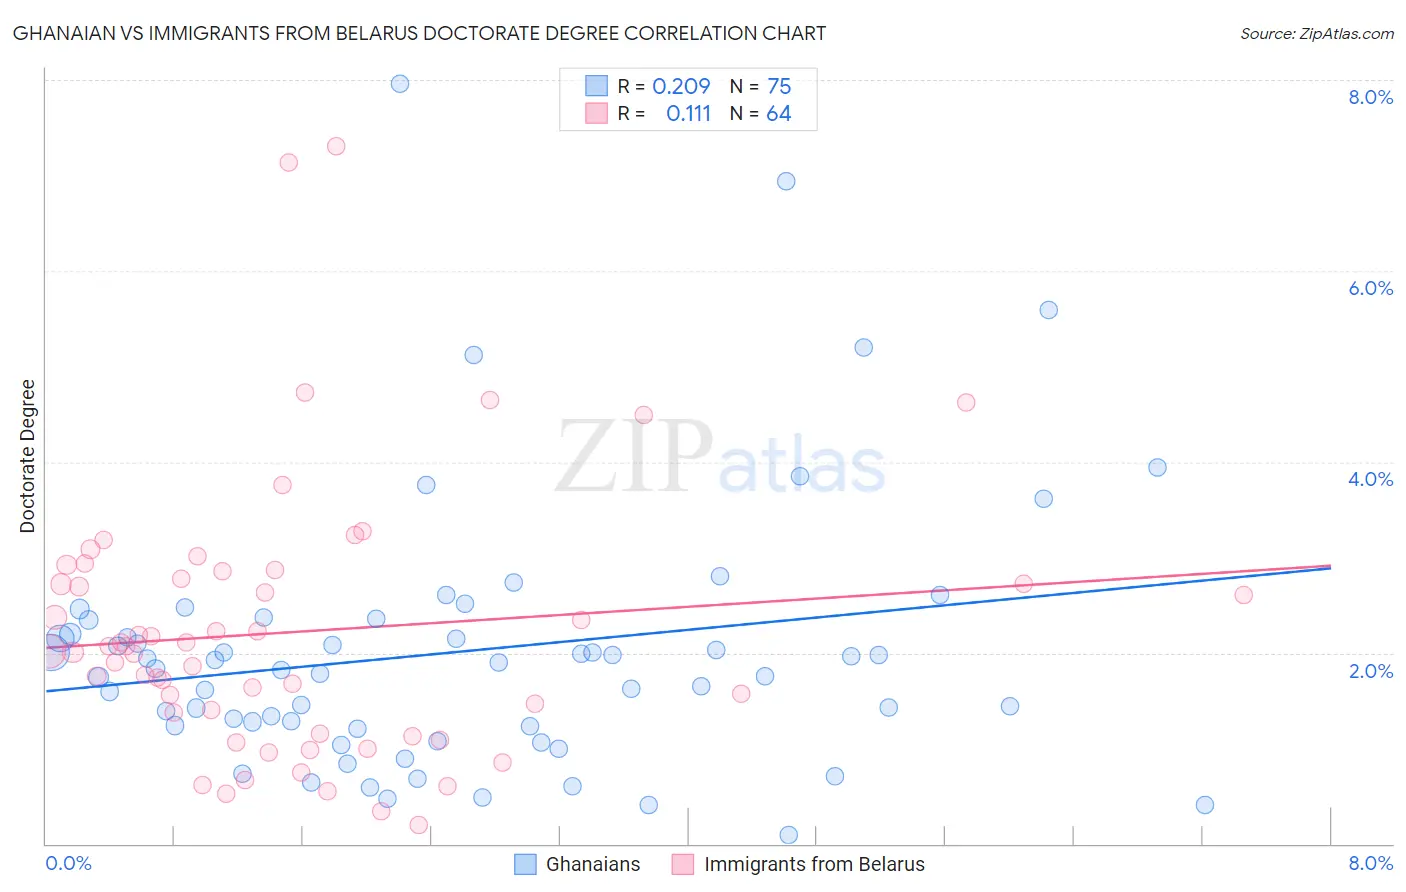
Ghanaian vs Immigrants from Belarus Doctorate Degree Correlation Chart
The statistical analysis conducted on geographies consisting of 190,123,841 people shows a weak positive correlation between the proportion of Ghanaians and percentage of population with at least doctorate degree education in the United States with a correlation coefficient (R) of 0.209 and weighted average of 1.8%. Similarly, the statistical analysis conducted on geographies consisting of 150,000,226 people shows a poor positive correlation between the proportion of Immigrants from Belarus and percentage of population with at least doctorate degree education in the United States with a correlation coefficient (R) of 0.111 and weighted average of 2.2%, a difference of 21.8%.
Doctorate Degree Correlation Summary
| Measurement | Ghanaian | Immigrants from Belarus |
| Minimum | 0.098% | 0.19% |
| Maximum | 8.0% | 7.3% |
| Range | 7.9% | 7.1% |
| Mean | 2.0% | 2.2% |
| Median | 1.8% | 2.0% |
| Interquartile 25% (IQ1) | 1.2% | 1.3% |
| Interquartile 75% (IQ3) | 2.3% | 2.8% |
| Interquartile Range (IQR) | 1.1% | 1.6% |
| Standard Deviation (Sample) | 1.4% | 1.4% |
| Standard Deviation (Population) | 1.4% | 1.4% |
Similar Demographics by Doctorate Degree
Demographics Similar to Ghanaians by Doctorate Degree
In terms of doctorate degree, the demographic groups most similar to Ghanaians are Scandinavian (1.8%, a difference of 0.050%), French (1.8%, a difference of 0.070%), Iraqi (1.8%, a difference of 0.13%), Spanish (1.8%, a difference of 0.15%), and Immigrants from Thailand (1.8%, a difference of 0.16%).
| Demographics | Rating | Rank | Doctorate Degree |
| Belgians | 50.3 /100 | #172 | Average 1.8% |
| Norwegians | 50.0 /100 | #173 | Average 1.8% |
| Immigrants | Bangladesh | 50.0 /100 | #174 | Average 1.8% |
| Immigrants | Thailand | 49.4 /100 | #175 | Average 1.8% |
| Spanish | 49.3 /100 | #176 | Average 1.8% |
| Iraqis | 49.2 /100 | #177 | Average 1.8% |
| French | 48.8 /100 | #178 | Average 1.8% |
| Ghanaians | 48.3 /100 | #179 | Average 1.8% |
| Scandinavians | 48.0 /100 | #180 | Average 1.8% |
| Immigrants | Immigrants | 46.2 /100 | #181 | Average 1.8% |
| Immigrants | Afghanistan | 44.3 /100 | #182 | Average 1.8% |
| Finns | 42.1 /100 | #183 | Average 1.8% |
| Nigerians | 39.9 /100 | #184 | Fair 1.8% |
| Slovaks | 36.4 /100 | #185 | Fair 1.8% |
| Peruvians | 34.4 /100 | #186 | Fair 1.8% |
Demographics Similar to Immigrants from Belarus by Doctorate Degree
In terms of doctorate degree, the demographic groups most similar to Immigrants from Belarus are Northern European (2.2%, a difference of 0.070%), Ugandan (2.2%, a difference of 0.35%), Immigrants from Argentina (2.2%, a difference of 0.40%), Immigrants from Lebanon (2.2%, a difference of 0.52%), and Immigrants from Hungary (2.2%, a difference of 0.53%).
| Demographics | Rating | Rank | Doctorate Degree |
| Immigrants | Bolivia | 99.8 /100 | #71 | Exceptional 2.3% |
| Immigrants | Canada | 99.8 /100 | #72 | Exceptional 2.3% |
| Immigrants | Bulgaria | 99.8 /100 | #73 | Exceptional 2.3% |
| Immigrants | North America | 99.8 /100 | #74 | Exceptional 2.2% |
| Immigrants | Western Asia | 99.8 /100 | #75 | Exceptional 2.2% |
| Immigrants | Hungary | 99.8 /100 | #76 | Exceptional 2.2% |
| Immigrants | Lebanon | 99.8 /100 | #77 | Exceptional 2.2% |
| Immigrants | Belarus | 99.7 /100 | #78 | Exceptional 2.2% |
| Northern Europeans | 99.7 /100 | #79 | Exceptional 2.2% |
| Ugandans | 99.7 /100 | #80 | Exceptional 2.2% |
| Immigrants | Argentina | 99.7 /100 | #81 | Exceptional 2.2% |
| Immigrants | Uganda | 99.6 /100 | #82 | Exceptional 2.2% |
| Immigrants | Lithuania | 99.6 /100 | #83 | Exceptional 2.2% |
| Immigrants | England | 99.6 /100 | #84 | Exceptional 2.2% |
| Immigrants | Brazil | 99.6 /100 | #85 | Exceptional 2.2% |