Ghanaian vs Jordanian 2nd Grade
COMPARE
Ghanaian
Jordanian
2nd Grade
2nd Grade Comparison
Ghanaians
Jordanians
97.4%
2ND GRADE
0.1/ 100
METRIC RATING
274th/ 347
METRIC RANK
98.0%
2ND GRADE
74.5/ 100
METRIC RATING
148th/ 347
METRIC RANK
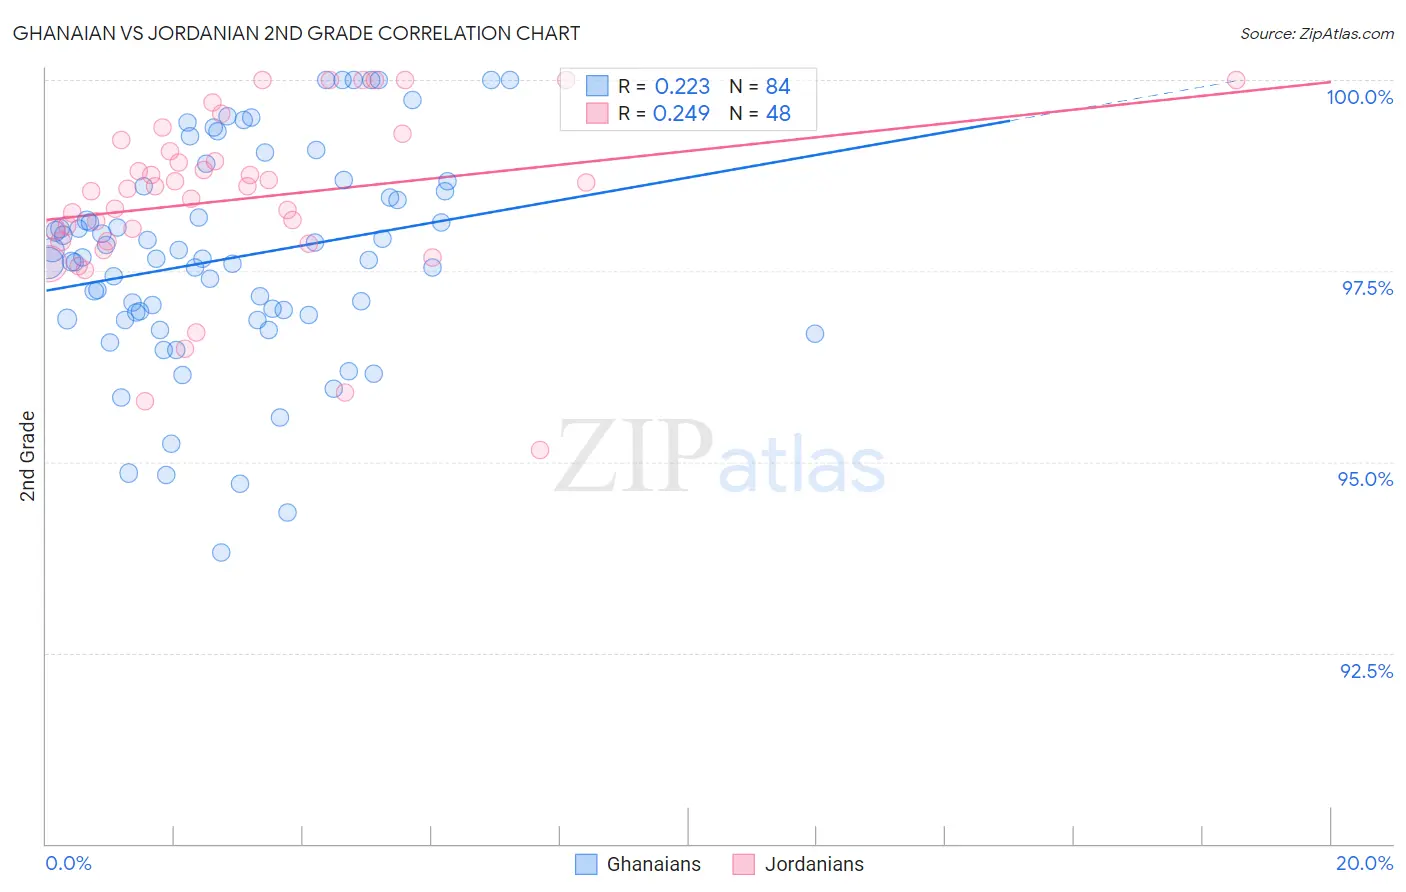
Ghanaian vs Jordanian 2nd Grade Correlation Chart
The statistical analysis conducted on geographies consisting of 190,712,873 people shows a weak positive correlation between the proportion of Ghanaians and percentage of population with at least 2nd grade education in the United States with a correlation coefficient (R) of 0.223 and weighted average of 97.4%. Similarly, the statistical analysis conducted on geographies consisting of 166,423,717 people shows a weak positive correlation between the proportion of Jordanians and percentage of population with at least 2nd grade education in the United States with a correlation coefficient (R) of 0.249 and weighted average of 98.0%, a difference of 0.62%.
2nd Grade Correlation Summary
| Measurement | Ghanaian | Jordanian |
| Minimum | 93.8% | 95.2% |
| Maximum | 100.0% | 100.0% |
| Range | 6.2% | 4.8% |
| Mean | 97.7% | 98.4% |
| Median | 97.7% | 98.6% |
| Interquartile 25% (IQ1) | 96.9% | 97.9% |
| Interquartile 75% (IQ3) | 98.6% | 99.1% |
| Interquartile Range (IQR) | 1.7% | 1.3% |
| Standard Deviation (Sample) | 1.4% | 1.1% |
| Standard Deviation (Population) | 1.4% | 1.1% |
Similar Demographics by 2nd Grade
Demographics Similar to Ghanaians by 2nd Grade
In terms of 2nd grade, the demographic groups most similar to Ghanaians are Immigrants from China (97.3%, a difference of 0.0%), Immigrants from Bolivia (97.4%, a difference of 0.010%), Immigrants from Cameroon (97.4%, a difference of 0.020%), Immigrants from Peru (97.4%, a difference of 0.020%), and Immigrants from Philippines (97.3%, a difference of 0.030%).
| Demographics | Rating | Rank | 2nd Grade |
| Cubans | 0.3 /100 | #267 | Tragic 97.4% |
| Immigrants | Nigeria | 0.3 /100 | #268 | Tragic 97.4% |
| West Indians | 0.3 /100 | #269 | Tragic 97.4% |
| Immigrants | Jamaica | 0.2 /100 | #270 | Tragic 97.4% |
| Immigrants | Cameroon | 0.2 /100 | #271 | Tragic 97.4% |
| Immigrants | Peru | 0.1 /100 | #272 | Tragic 97.4% |
| Immigrants | Bolivia | 0.1 /100 | #273 | Tragic 97.4% |
| Ghanaians | 0.1 /100 | #274 | Tragic 97.4% |
| Immigrants | China | 0.1 /100 | #275 | Tragic 97.3% |
| Immigrants | Philippines | 0.1 /100 | #276 | Tragic 97.3% |
| Immigrants | Western Africa | 0.1 /100 | #277 | Tragic 97.3% |
| Immigrants | Uzbekistan | 0.1 /100 | #278 | Tragic 97.3% |
| Immigrants | Ghana | 0.1 /100 | #279 | Tragic 97.3% |
| Afghans | 0.1 /100 | #280 | Tragic 97.3% |
| Trinidadians and Tobagonians | 0.1 /100 | #281 | Tragic 97.3% |
Demographics Similar to Jordanians by 2nd Grade
In terms of 2nd grade, the demographic groups most similar to Jordanians are Apache (97.9%, a difference of 0.0%), Immigrants from Greece (98.0%, a difference of 0.010%), Immigrants from Moldova (97.9%, a difference of 0.010%), Hmong (98.0%, a difference of 0.020%), and Filipino (98.0%, a difference of 0.020%).
| Demographics | Rating | Rank | 2nd Grade |
| Immigrants | Turkey | 83.0 /100 | #141 | Excellent 98.0% |
| Burmese | 81.0 /100 | #142 | Excellent 98.0% |
| Alsatians | 80.5 /100 | #143 | Excellent 98.0% |
| Hmong | 80.0 /100 | #144 | Good 98.0% |
| Filipinos | 79.2 /100 | #145 | Good 98.0% |
| Immigrants | Israel | 78.0 /100 | #146 | Good 98.0% |
| Immigrants | Greece | 76.8 /100 | #147 | Good 98.0% |
| Jordanians | 74.5 /100 | #148 | Good 98.0% |
| Apache | 74.0 /100 | #149 | Good 97.9% |
| Immigrants | Moldova | 72.9 /100 | #150 | Good 97.9% |
| Soviet Union | 70.7 /100 | #151 | Good 97.9% |
| Immigrants | North Macedonia | 68.5 /100 | #152 | Good 97.9% |
| Immigrants | South Central Asia | 68.3 /100 | #153 | Good 97.9% |
| Marshallese | 67.7 /100 | #154 | Good 97.9% |
| French American Indians | 64.3 /100 | #155 | Good 97.9% |