Ghanaian vs Ugandan 2nd Grade
COMPARE
Ghanaian
Ugandan
2nd Grade
2nd Grade Comparison
Ghanaians
Ugandans
97.4%
2ND GRADE
0.1/ 100
METRIC RATING
274th/ 347
METRIC RANK
97.9%
2ND GRADE
56.6/ 100
METRIC RATING
164th/ 347
METRIC RANK
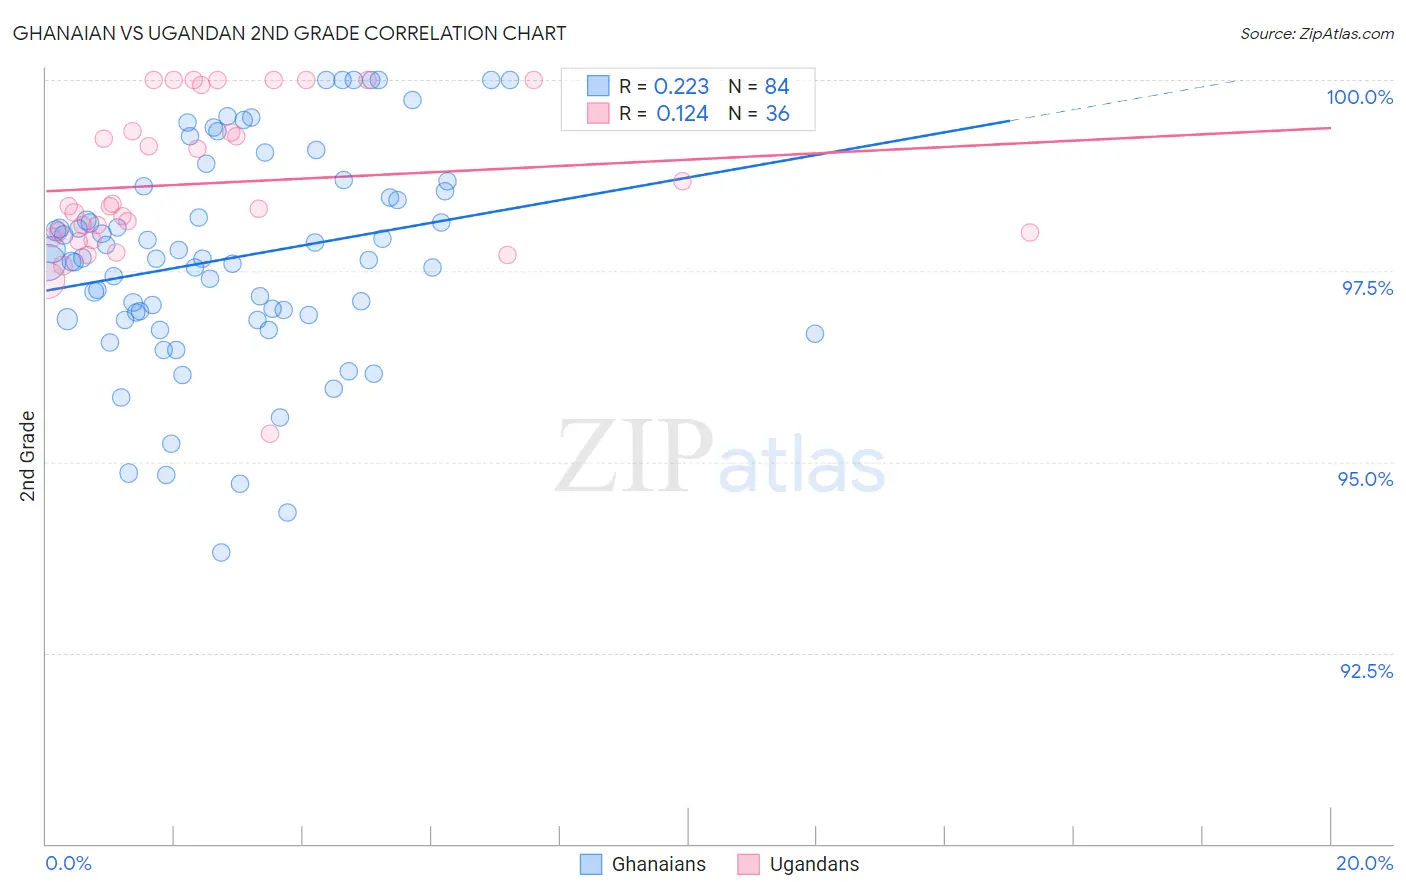
Ghanaian vs Ugandan 2nd Grade Correlation Chart
The statistical analysis conducted on geographies consisting of 190,712,873 people shows a weak positive correlation between the proportion of Ghanaians and percentage of population with at least 2nd grade education in the United States with a correlation coefficient (R) of 0.223 and weighted average of 97.4%. Similarly, the statistical analysis conducted on geographies consisting of 93,991,892 people shows a poor positive correlation between the proportion of Ugandans and percentage of population with at least 2nd grade education in the United States with a correlation coefficient (R) of 0.124 and weighted average of 97.9%, a difference of 0.55%.
2nd Grade Correlation Summary
| Measurement | Ghanaian | Ugandan |
| Minimum | 93.8% | 95.4% |
| Maximum | 100.0% | 100.0% |
| Range | 6.2% | 4.6% |
| Mean | 97.7% | 98.7% |
| Median | 97.7% | 98.3% |
| Interquartile 25% (IQ1) | 96.9% | 98.0% |
| Interquartile 75% (IQ3) | 98.6% | 99.6% |
| Interquartile Range (IQR) | 1.7% | 1.7% |
| Standard Deviation (Sample) | 1.4% | 1.0% |
| Standard Deviation (Population) | 1.4% | 1.0% |
Similar Demographics by 2nd Grade
Demographics Similar to Ghanaians by 2nd Grade
In terms of 2nd grade, the demographic groups most similar to Ghanaians are Immigrants from China (97.3%, a difference of 0.0%), Immigrants from Bolivia (97.4%, a difference of 0.010%), Immigrants from Cameroon (97.4%, a difference of 0.020%), Immigrants from Peru (97.4%, a difference of 0.020%), and Immigrants from Philippines (97.3%, a difference of 0.030%).
| Demographics | Rating | Rank | 2nd Grade |
| Cubans | 0.3 /100 | #267 | Tragic 97.4% |
| Immigrants | Nigeria | 0.3 /100 | #268 | Tragic 97.4% |
| West Indians | 0.3 /100 | #269 | Tragic 97.4% |
| Immigrants | Jamaica | 0.2 /100 | #270 | Tragic 97.4% |
| Immigrants | Cameroon | 0.2 /100 | #271 | Tragic 97.4% |
| Immigrants | Peru | 0.1 /100 | #272 | Tragic 97.4% |
| Immigrants | Bolivia | 0.1 /100 | #273 | Tragic 97.4% |
| Ghanaians | 0.1 /100 | #274 | Tragic 97.4% |
| Immigrants | China | 0.1 /100 | #275 | Tragic 97.3% |
| Immigrants | Philippines | 0.1 /100 | #276 | Tragic 97.3% |
| Immigrants | Western Africa | 0.1 /100 | #277 | Tragic 97.3% |
| Immigrants | Uzbekistan | 0.1 /100 | #278 | Tragic 97.3% |
| Immigrants | Ghana | 0.1 /100 | #279 | Tragic 97.3% |
| Afghans | 0.1 /100 | #280 | Tragic 97.3% |
| Trinidadians and Tobagonians | 0.1 /100 | #281 | Tragic 97.3% |
Demographics Similar to Ugandans by 2nd Grade
In terms of 2nd grade, the demographic groups most similar to Ugandans are Spanish American (97.9%, a difference of 0.0%), Immigrants from Jordan (97.9%, a difference of 0.0%), Chilean (97.9%, a difference of 0.0%), Brazilian (97.9%, a difference of 0.0%), and Immigrants from Spain (97.9%, a difference of 0.0%).
| Demographics | Rating | Rank | 2nd Grade |
| Venezuelans | 63.3 /100 | #157 | Good 97.9% |
| Immigrants | Iran | 62.8 /100 | #158 | Good 97.9% |
| Comanche | 62.8 /100 | #159 | Good 97.9% |
| Immigrants | Eastern Europe | 61.1 /100 | #160 | Good 97.9% |
| Immigrants | Russia | 60.3 /100 | #161 | Good 97.9% |
| Immigrants | Italy | 60.2 /100 | #162 | Good 97.9% |
| Bermudans | 59.4 /100 | #163 | Average 97.9% |
| Ugandans | 56.6 /100 | #164 | Average 97.9% |
| Spanish Americans | 56.4 /100 | #165 | Average 97.9% |
| Immigrants | Jordan | 56.3 /100 | #166 | Average 97.9% |
| Chileans | 56.1 /100 | #167 | Average 97.9% |
| Brazilians | 55.8 /100 | #168 | Average 97.9% |
| Immigrants | Spain | 55.4 /100 | #169 | Average 97.9% |
| Navajo | 54.3 /100 | #170 | Average 97.9% |
| Albanians | 52.8 /100 | #171 | Average 97.9% |