Ghanaian vs Immigrants from Somalia Master's Degree
COMPARE
Ghanaian
Immigrants from Somalia
Master's Degree
Master's Degree Comparison
Ghanaians
Immigrants from Somalia
15.5%
MASTER'S DEGREE
78.2/ 100
METRIC RATING
149th/ 347
METRIC RANK
14.1%
MASTER'S DEGREE
15.8/ 100
METRIC RATING
216th/ 347
METRIC RANK
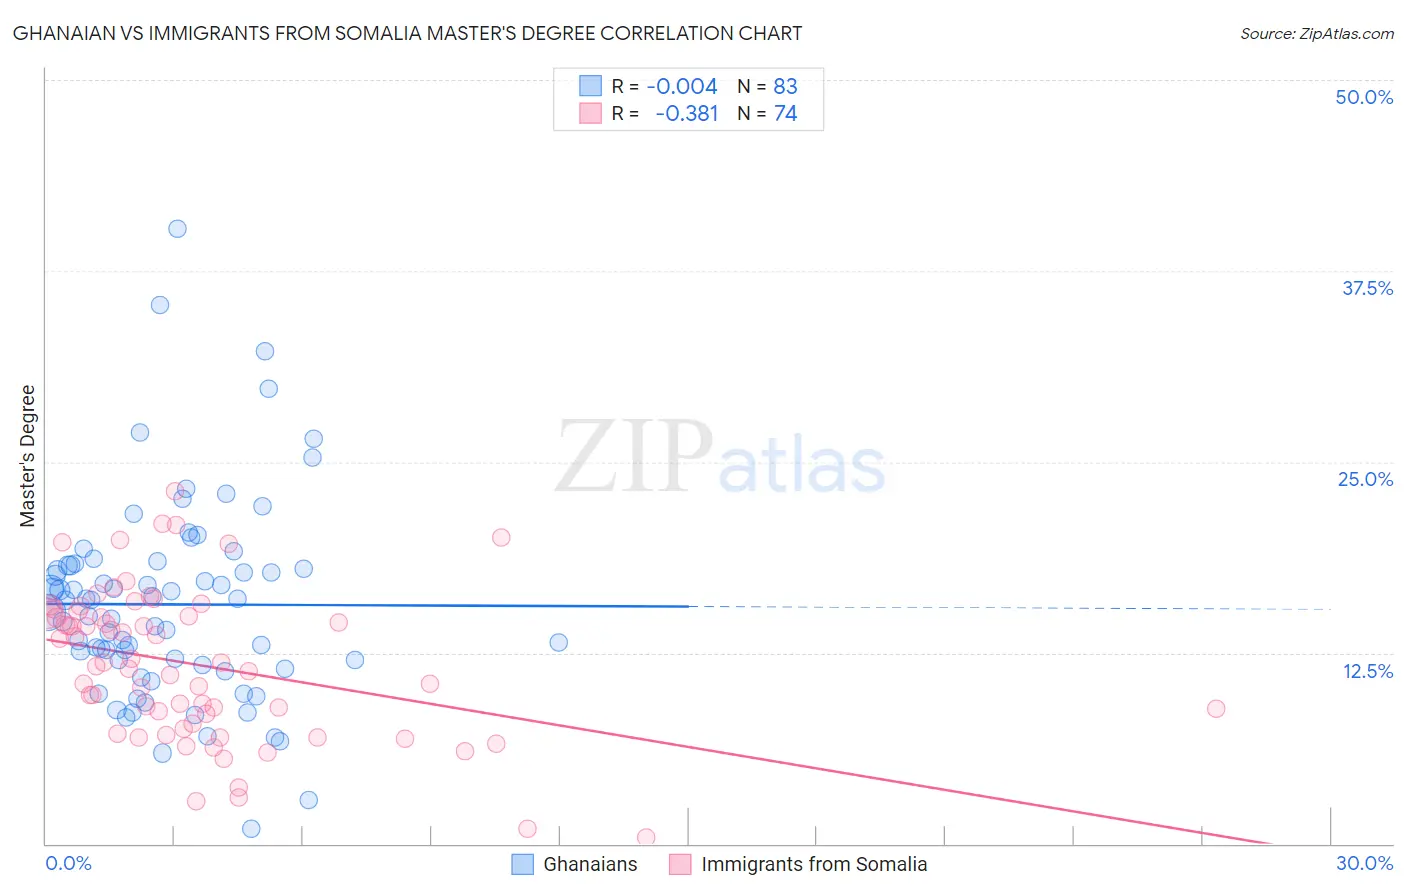
Ghanaian vs Immigrants from Somalia Master's Degree Correlation Chart
The statistical analysis conducted on geographies consisting of 190,610,079 people shows no correlation between the proportion of Ghanaians and percentage of population with at least master's degree education in the United States with a correlation coefficient (R) of -0.004 and weighted average of 15.5%. Similarly, the statistical analysis conducted on geographies consisting of 92,109,960 people shows a mild negative correlation between the proportion of Immigrants from Somalia and percentage of population with at least master's degree education in the United States with a correlation coefficient (R) of -0.381 and weighted average of 14.1%, a difference of 10.0%.
Master's Degree Correlation Summary
| Measurement | Ghanaian | Immigrants from Somalia |
| Minimum | 0.95% | 0.40% |
| Maximum | 40.3% | 23.1% |
| Range | 39.3% | 22.7% |
| Mean | 15.7% | 11.7% |
| Median | 15.9% | 11.7% |
| Interquartile 25% (IQ1) | 11.7% | 7.9% |
| Interquartile 75% (IQ3) | 18.2% | 15.1% |
| Interquartile Range (IQR) | 6.5% | 7.2% |
| Standard Deviation (Sample) | 6.6% | 4.9% |
| Standard Deviation (Population) | 6.6% | 4.9% |
Similar Demographics by Master's Degree
Demographics Similar to Ghanaians by Master's Degree
In terms of master's degree, the demographic groups most similar to Ghanaians are Immigrants from Senegal (15.5%, a difference of 0.010%), Slovene (15.5%, a difference of 0.030%), Iraqi (15.5%, a difference of 0.16%), Hungarian (15.6%, a difference of 0.18%), and Slavic (15.5%, a difference of 0.21%).
| Demographics | Rating | Rank | Master's Degree |
| Immigrants | Africa | 84.0 /100 | #142 | Excellent 15.7% |
| Immigrants | Venezuela | 83.6 /100 | #143 | Excellent 15.7% |
| Canadians | 83.3 /100 | #144 | Excellent 15.7% |
| South Americans | 81.3 /100 | #145 | Excellent 15.6% |
| Immigrants | Afghanistan | 79.4 /100 | #146 | Good 15.6% |
| Hungarians | 79.1 /100 | #147 | Good 15.6% |
| Immigrants | Senegal | 78.2 /100 | #148 | Good 15.5% |
| Ghanaians | 78.2 /100 | #149 | Good 15.5% |
| Slovenes | 78.0 /100 | #150 | Good 15.5% |
| Iraqis | 77.3 /100 | #151 | Good 15.5% |
| Slavs | 77.0 /100 | #152 | Good 15.5% |
| Icelanders | 76.8 /100 | #153 | Good 15.5% |
| Immigrants | South America | 76.3 /100 | #154 | Good 15.5% |
| Immigrants | Bangladesh | 76.1 /100 | #155 | Good 15.5% |
| Bermudans | 73.9 /100 | #156 | Good 15.4% |
Demographics Similar to Immigrants from Somalia by Master's Degree
In terms of master's degree, the demographic groups most similar to Immigrants from Somalia are Immigrants from Trinidad and Tobago (14.1%, a difference of 0.0%), Immigrants from Vietnam (14.1%, a difference of 0.070%), French Canadian (14.1%, a difference of 0.25%), Finnish (14.2%, a difference of 0.27%), and Immigrants from Thailand (14.2%, a difference of 0.29%).
| Demographics | Rating | Rank | Master's Degree |
| Immigrants | Panama | 20.0 /100 | #209 | Fair 14.3% |
| Sub-Saharan Africans | 19.4 /100 | #210 | Poor 14.2% |
| Somalis | 18.0 /100 | #211 | Poor 14.2% |
| Spanish | 17.8 /100 | #212 | Poor 14.2% |
| Immigrants | Thailand | 17.0 /100 | #213 | Poor 14.2% |
| Finns | 16.9 /100 | #214 | Poor 14.2% |
| Immigrants | Vietnam | 16.1 /100 | #215 | Poor 14.1% |
| Immigrants | Somalia | 15.8 /100 | #216 | Poor 14.1% |
| Immigrants | Trinidad and Tobago | 15.8 /100 | #217 | Poor 14.1% |
| French Canadians | 14.9 /100 | #218 | Poor 14.1% |
| Norwegians | 13.6 /100 | #219 | Poor 14.0% |
| Germans | 13.1 /100 | #220 | Poor 14.0% |
| Koreans | 12.7 /100 | #221 | Poor 14.0% |
| Ecuadorians | 12.6 /100 | #222 | Poor 14.0% |
| Immigrants | South Eastern Asia | 11.9 /100 | #223 | Poor 14.0% |