Ghanaian vs Immigrants from Pakistan In Labor Force | Age 20-64
COMPARE
Ghanaian
Immigrants from Pakistan
In Labor Force | Age 20-64
In Labor Force | Age 20-64 Comparison
Ghanaians
Immigrants from Pakistan
80.1%
IN LABOR FORCE | AGE 20-64
96.7/ 100
METRIC RATING
92nd/ 347
METRIC RANK
80.5%
IN LABOR FORCE | AGE 20-64
99.6/ 100
METRIC RATING
46th/ 347
METRIC RANK
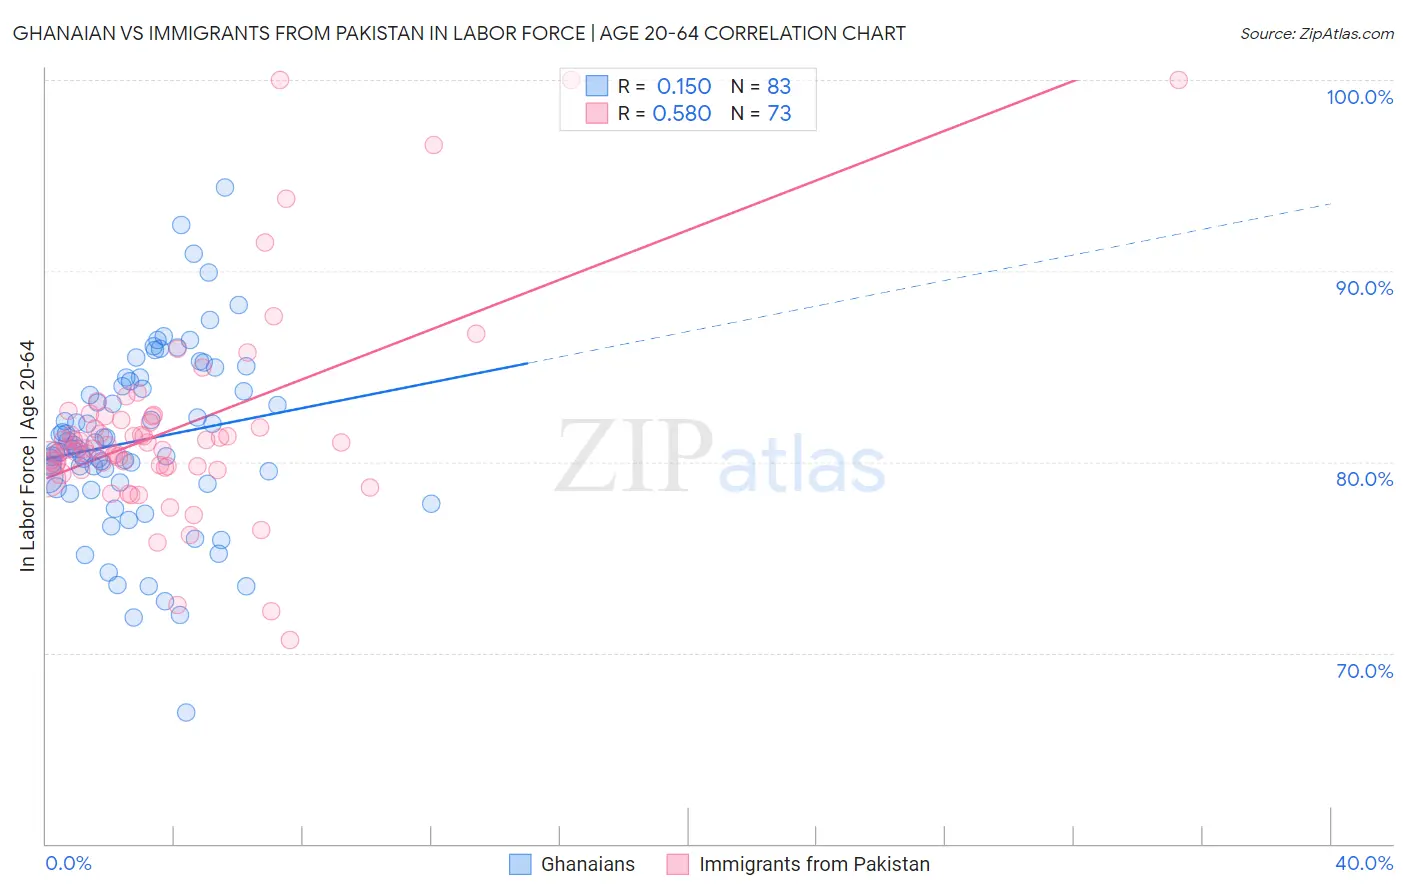
Ghanaian vs Immigrants from Pakistan In Labor Force | Age 20-64 Correlation Chart
The statistical analysis conducted on geographies consisting of 190,721,874 people shows a poor positive correlation between the proportion of Ghanaians and labor force participation rate among population between the ages 20 and 64 in the United States with a correlation coefficient (R) of 0.150 and weighted average of 80.1%. Similarly, the statistical analysis conducted on geographies consisting of 283,910,968 people shows a substantial positive correlation between the proportion of Immigrants from Pakistan and labor force participation rate among population between the ages 20 and 64 in the United States with a correlation coefficient (R) of 0.580 and weighted average of 80.5%, a difference of 0.46%.
In Labor Force | Age 20-64 Correlation Summary
| Measurement | Ghanaian | Immigrants from Pakistan |
| Minimum | 66.9% | 70.7% |
| Maximum | 94.4% | 100.0% |
| Range | 27.5% | 29.3% |
| Mean | 81.1% | 81.8% |
| Median | 80.9% | 80.9% |
| Interquartile 25% (IQ1) | 78.8% | 79.7% |
| Interquartile 75% (IQ3) | 84.2% | 82.4% |
| Interquartile Range (IQR) | 5.4% | 2.7% |
| Standard Deviation (Sample) | 4.7% | 5.4% |
| Standard Deviation (Population) | 4.7% | 5.4% |
Similar Demographics by In Labor Force | Age 20-64
Demographics Similar to Ghanaians by In Labor Force | Age 20-64
In terms of in labor force | age 20-64, the demographic groups most similar to Ghanaians are Uruguayan (80.1%, a difference of 0.0%), Immigrants from Venezuela (80.1%, a difference of 0.010%), Polish (80.1%, a difference of 0.010%), Chilean (80.1%, a difference of 0.020%), and Immigrants from Belarus (80.1%, a difference of 0.020%).
| Demographics | Rating | Rank | In Labor Force | Age 20-64 |
| Jordanians | 97.2 /100 | #85 | Exceptional 80.1% |
| Immigrants | Egypt | 97.1 /100 | #86 | Exceptional 80.1% |
| Croatians | 97.1 /100 | #87 | Exceptional 80.1% |
| Chileans | 97.0 /100 | #88 | Exceptional 80.1% |
| Immigrants | Venezuela | 96.8 /100 | #89 | Exceptional 80.1% |
| Poles | 96.8 /100 | #90 | Exceptional 80.1% |
| Uruguayans | 96.7 /100 | #91 | Exceptional 80.1% |
| Ghanaians | 96.7 /100 | #92 | Exceptional 80.1% |
| Immigrants | Belarus | 96.4 /100 | #93 | Exceptional 80.1% |
| Immigrants | Asia | 96.0 /100 | #94 | Exceptional 80.1% |
| Yugoslavians | 95.9 /100 | #95 | Exceptional 80.1% |
| Immigrants | Malaysia | 95.9 /100 | #96 | Exceptional 80.1% |
| South Americans | 95.9 /100 | #97 | Exceptional 80.1% |
| Immigrants | Uruguay | 95.8 /100 | #98 | Exceptional 80.1% |
| Immigrants | Chile | 95.7 /100 | #99 | Exceptional 80.1% |
Demographics Similar to Immigrants from Pakistan by In Labor Force | Age 20-64
In terms of in labor force | age 20-64, the demographic groups most similar to Immigrants from Pakistan are Slovene (80.5%, a difference of 0.010%), Immigrants from Middle Africa (80.5%, a difference of 0.030%), Immigrants from Africa (80.4%, a difference of 0.040%), Immigrants from Hong Kong (80.4%, a difference of 0.060%), and Latvian (80.5%, a difference of 0.070%).
| Demographics | Rating | Rank | In Labor Force | Age 20-64 |
| Brazilians | 99.8 /100 | #39 | Exceptional 80.5% |
| Immigrants | Zimbabwe | 99.8 /100 | #40 | Exceptional 80.5% |
| Immigrants | Liberia | 99.8 /100 | #41 | Exceptional 80.5% |
| Latvians | 99.8 /100 | #42 | Exceptional 80.5% |
| Czechs | 99.7 /100 | #43 | Exceptional 80.5% |
| Immigrants | Middle Africa | 99.7 /100 | #44 | Exceptional 80.5% |
| Slovenes | 99.7 /100 | #45 | Exceptional 80.5% |
| Immigrants | Pakistan | 99.6 /100 | #46 | Exceptional 80.5% |
| Immigrants | Africa | 99.6 /100 | #47 | Exceptional 80.4% |
| Immigrants | Hong Kong | 99.5 /100 | #48 | Exceptional 80.4% |
| Immigrants | Greece | 99.4 /100 | #49 | Exceptional 80.4% |
| Immigrants | Sudan | 99.4 /100 | #50 | Exceptional 80.4% |
| Immigrants | Sri Lanka | 99.3 /100 | #51 | Exceptional 80.4% |
| Turks | 99.2 /100 | #52 | Exceptional 80.3% |
| Immigrants | Peru | 99.2 /100 | #53 | Exceptional 80.3% |