Immigrants from Costa Rica vs Immigrants from Caribbean High School Diploma
COMPARE
Immigrants from Costa Rica
Immigrants from Caribbean
High School Diploma
High School Diploma Comparison
Immigrants from Costa Rica
Immigrants from Caribbean
87.8%
HIGH SCHOOL DIPLOMA
1.7/ 100
METRIC RATING
247th/ 347
METRIC RANK
84.3%
HIGH SCHOOL DIPLOMA
0.0/ 100
METRIC RATING
317th/ 347
METRIC RANK
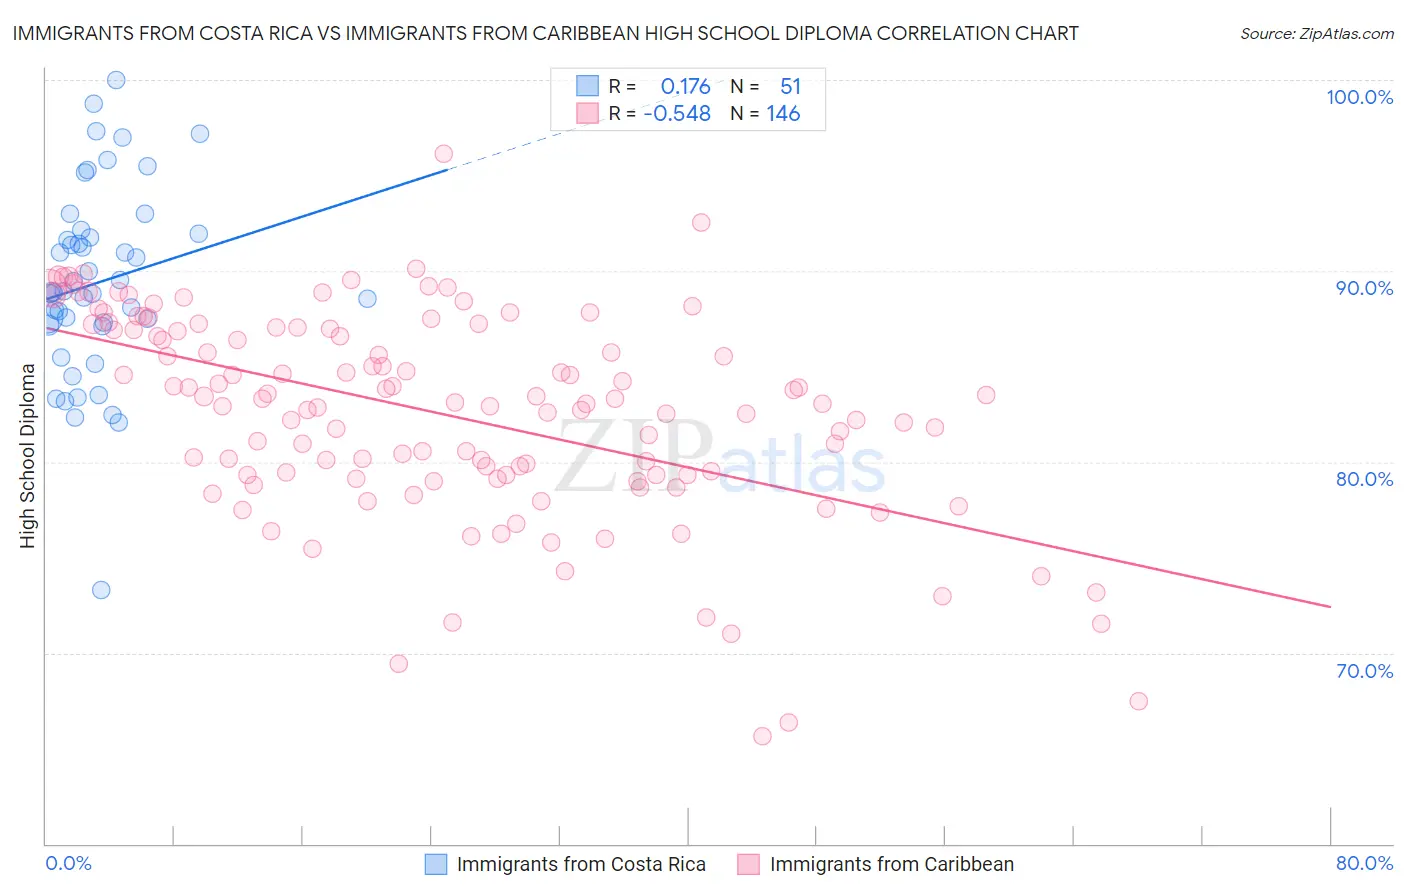
Immigrants from Costa Rica vs Immigrants from Caribbean High School Diploma Correlation Chart
The statistical analysis conducted on geographies consisting of 204,277,241 people shows a poor positive correlation between the proportion of Immigrants from Costa Rica and percentage of population with at least high school diploma education in the United States with a correlation coefficient (R) of 0.176 and weighted average of 87.8%. Similarly, the statistical analysis conducted on geographies consisting of 450,064,503 people shows a substantial negative correlation between the proportion of Immigrants from Caribbean and percentage of population with at least high school diploma education in the United States with a correlation coefficient (R) of -0.548 and weighted average of 84.3%, a difference of 4.2%.
High School Diploma Correlation Summary
| Measurement | Immigrants from Costa Rica | Immigrants from Caribbean |
| Minimum | 73.3% | 65.6% |
| Maximum | 100.0% | 96.2% |
| Range | 26.7% | 30.5% |
| Mean | 89.4% | 82.5% |
| Median | 88.9% | 83.1% |
| Interquartile 25% (IQ1) | 87.2% | 79.3% |
| Interquartile 75% (IQ3) | 92.0% | 87.0% |
| Interquartile Range (IQR) | 4.8% | 7.7% |
| Standard Deviation (Sample) | 5.0% | 5.4% |
| Standard Deviation (Population) | 4.9% | 5.4% |
Similar Demographics by High School Diploma
Demographics Similar to Immigrants from Costa Rica by High School Diploma
In terms of high school diploma, the demographic groups most similar to Immigrants from Costa Rica are Immigrants from Eritrea (87.8%, a difference of 0.0%), Peruvian (87.8%, a difference of 0.040%), Spanish American (87.7%, a difference of 0.040%), Immigrants from Philippines (87.8%, a difference of 0.050%), and Choctaw (87.8%, a difference of 0.050%).
| Demographics | Rating | Rank | High School Diploma |
| Comanche | 2.2 /100 | #240 | Tragic 87.9% |
| Immigrants | Uzbekistan | 2.1 /100 | #241 | Tragic 87.8% |
| Cheyenne | 2.1 /100 | #242 | Tragic 87.8% |
| Immigrants | Philippines | 1.9 /100 | #243 | Tragic 87.8% |
| Choctaw | 1.9 /100 | #244 | Tragic 87.8% |
| Peruvians | 1.9 /100 | #245 | Tragic 87.8% |
| Immigrants | Eritrea | 1.7 /100 | #246 | Tragic 87.8% |
| Immigrants | Costa Rica | 1.7 /100 | #247 | Tragic 87.8% |
| Spanish Americans | 1.5 /100 | #248 | Tragic 87.7% |
| Senegalese | 1.5 /100 | #249 | Tragic 87.7% |
| Immigrants | Nigeria | 1.5 /100 | #250 | Tragic 87.7% |
| Ghanaians | 1.4 /100 | #251 | Tragic 87.7% |
| Immigrants | South America | 1.2 /100 | #252 | Tragic 87.6% |
| Immigrants | Uruguay | 1.0 /100 | #253 | Tragic 87.6% |
| Immigrants | Colombia | 1.0 /100 | #254 | Tragic 87.6% |
Demographics Similar to Immigrants from Caribbean by High School Diploma
In terms of high school diploma, the demographic groups most similar to Immigrants from Caribbean are Belizean (84.3%, a difference of 0.060%), Immigrants from Belize (84.2%, a difference of 0.070%), Central American Indian (84.2%, a difference of 0.11%), Nicaraguan (84.1%, a difference of 0.21%), and Yuman (84.0%, a difference of 0.34%).
| Demographics | Rating | Rank | High School Diploma |
| Apache | 0.0 /100 | #310 | Tragic 85.1% |
| Ecuadorians | 0.0 /100 | #311 | Tragic 85.1% |
| Cape Verdeans | 0.0 /100 | #312 | Tragic 85.1% |
| Immigrants | Ecuador | 0.0 /100 | #313 | Tragic 84.8% |
| Yaqui | 0.0 /100 | #314 | Tragic 84.7% |
| Puerto Ricans | 0.0 /100 | #315 | Tragic 84.7% |
| Belizeans | 0.0 /100 | #316 | Tragic 84.3% |
| Immigrants | Caribbean | 0.0 /100 | #317 | Tragic 84.3% |
| Immigrants | Belize | 0.0 /100 | #318 | Tragic 84.2% |
| Central American Indians | 0.0 /100 | #319 | Tragic 84.2% |
| Nicaraguans | 0.0 /100 | #320 | Tragic 84.1% |
| Yuman | 0.0 /100 | #321 | Tragic 84.0% |
| Lumbee | 0.0 /100 | #322 | Tragic 83.6% |
| Immigrants | Cuba | 0.0 /100 | #323 | Tragic 83.5% |
| Immigrants | Cabo Verde | 0.0 /100 | #324 | Tragic 83.3% |