German Russian vs Immigrants Professional Degree
COMPARE
German Russian
Immigrants
Professional Degree
Professional Degree Comparison
German Russians
Immigrants
4.0%
PROFESSIONAL DEGREE
6.1/ 100
METRIC RATING
226th/ 347
METRIC RANK
4.4%
PROFESSIONAL DEGREE
43.2/ 100
METRIC RATING
182nd/ 347
METRIC RANK
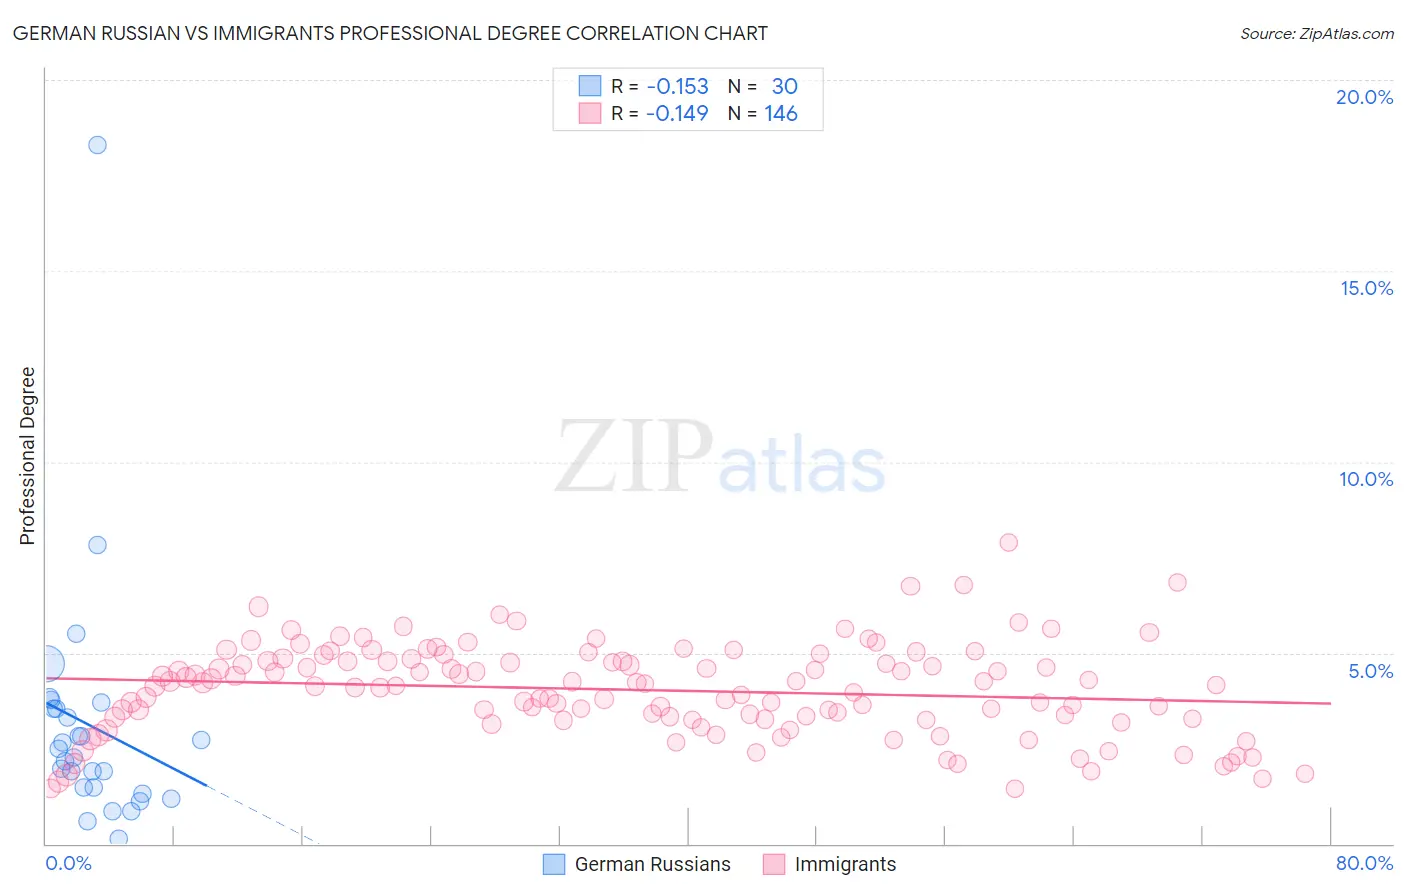
German Russian vs Immigrants Professional Degree Correlation Chart
The statistical analysis conducted on geographies consisting of 96,360,992 people shows a poor negative correlation between the proportion of German Russians and percentage of population with at least professional degree education in the United States with a correlation coefficient (R) of -0.153 and weighted average of 4.0%. Similarly, the statistical analysis conducted on geographies consisting of 568,546,540 people shows a poor negative correlation between the proportion of Immigrants and percentage of population with at least professional degree education in the United States with a correlation coefficient (R) of -0.149 and weighted average of 4.4%, a difference of 9.9%.
Professional Degree Correlation Summary
| Measurement | German Russian | Immigrants |
| Minimum | 0.15% | 1.4% |
| Maximum | 18.3% | 7.9% |
| Range | 18.2% | 6.4% |
| Mean | 3.1% | 4.0% |
| Median | 2.4% | 4.1% |
| Interquartile 25% (IQ1) | 1.5% | 3.3% |
| Interquartile 75% (IQ3) | 3.6% | 4.8% |
| Interquartile Range (IQR) | 2.1% | 1.5% |
| Standard Deviation (Sample) | 3.3% | 1.2% |
| Standard Deviation (Population) | 3.2% | 1.2% |
Similar Demographics by Professional Degree
Demographics Similar to German Russians by Professional Degree
In terms of professional degree, the demographic groups most similar to German Russians are Cuban (4.0%, a difference of 0.12%), Immigrants from West Indies (4.0%, a difference of 0.37%), Immigrants from Burma/Myanmar (3.9%, a difference of 0.52%), Tlingit-Haida (4.0%, a difference of 0.55%), and Trinidadian and Tobagonian (4.0%, a difference of 0.68%).
| Demographics | Rating | Rank | Professional Degree |
| Immigrants | South Eastern Asia | 8.9 /100 | #219 | Tragic 4.0% |
| Ute | 8.2 /100 | #220 | Tragic 4.0% |
| French Canadians | 8.0 /100 | #221 | Tragic 4.0% |
| Immigrants | Western Africa | 7.5 /100 | #222 | Tragic 4.0% |
| Immigrants | Bosnia and Herzegovina | 7.4 /100 | #223 | Tragic 4.0% |
| Trinidadians and Tobagonians | 7.1 /100 | #224 | Tragic 4.0% |
| Tlingit-Haida | 6.9 /100 | #225 | Tragic 4.0% |
| German Russians | 6.1 /100 | #226 | Tragic 4.0% |
| Cubans | 5.9 /100 | #227 | Tragic 4.0% |
| Immigrants | West Indies | 5.6 /100 | #228 | Tragic 4.0% |
| Immigrants | Burma/Myanmar | 5.4 /100 | #229 | Tragic 3.9% |
| Nicaraguans | 5.1 /100 | #230 | Tragic 3.9% |
| Ecuadorians | 4.6 /100 | #231 | Tragic 3.9% |
| Cree | 4.3 /100 | #232 | Tragic 3.9% |
| Immigrants | Philippines | 4.1 /100 | #233 | Tragic 3.9% |
Demographics Similar to Immigrants by Professional Degree
In terms of professional degree, the demographic groups most similar to Immigrants are Bermudan (4.4%, a difference of 0.010%), Danish (4.4%, a difference of 0.040%), Czech (4.4%, a difference of 0.26%), Immigrants from Kenya (4.4%, a difference of 0.41%), and Immigrants from Costa Rica (4.4%, a difference of 0.52%).
| Demographics | Rating | Rank | Professional Degree |
| Irish | 50.0 /100 | #175 | Average 4.4% |
| Immigrants | Peru | 49.3 /100 | #176 | Average 4.4% |
| Celtics | 47.6 /100 | #177 | Average 4.4% |
| Immigrants | Costa Rica | 46.7 /100 | #178 | Average 4.4% |
| Immigrants | Kenya | 45.9 /100 | #179 | Average 4.4% |
| Czechs | 44.9 /100 | #180 | Average 4.4% |
| Danes | 43.5 /100 | #181 | Average 4.4% |
| Immigrants | Immigrants | 43.2 /100 | #182 | Average 4.4% |
| Bermudans | 43.1 /100 | #183 | Average 4.4% |
| Belgians | 36.2 /100 | #184 | Fair 4.3% |
| Welsh | 35.8 /100 | #185 | Fair 4.3% |
| Scotch-Irish | 34.2 /100 | #186 | Fair 4.3% |
| Immigrants | Cameroon | 33.3 /100 | #187 | Fair 4.3% |
| Immigrants | Thailand | 31.7 /100 | #188 | Fair 4.3% |
| Slovaks | 30.7 /100 | #189 | Fair 4.3% |