German Russian vs Latvian Professional Degree
COMPARE
German Russian
Latvian
Professional Degree
Professional Degree Comparison
German Russians
Latvians
4.0%
PROFESSIONAL DEGREE
6.1/ 100
METRIC RATING
226th/ 347
METRIC RANK
6.2%
PROFESSIONAL DEGREE
100.0/ 100
METRIC RATING
26th/ 347
METRIC RANK
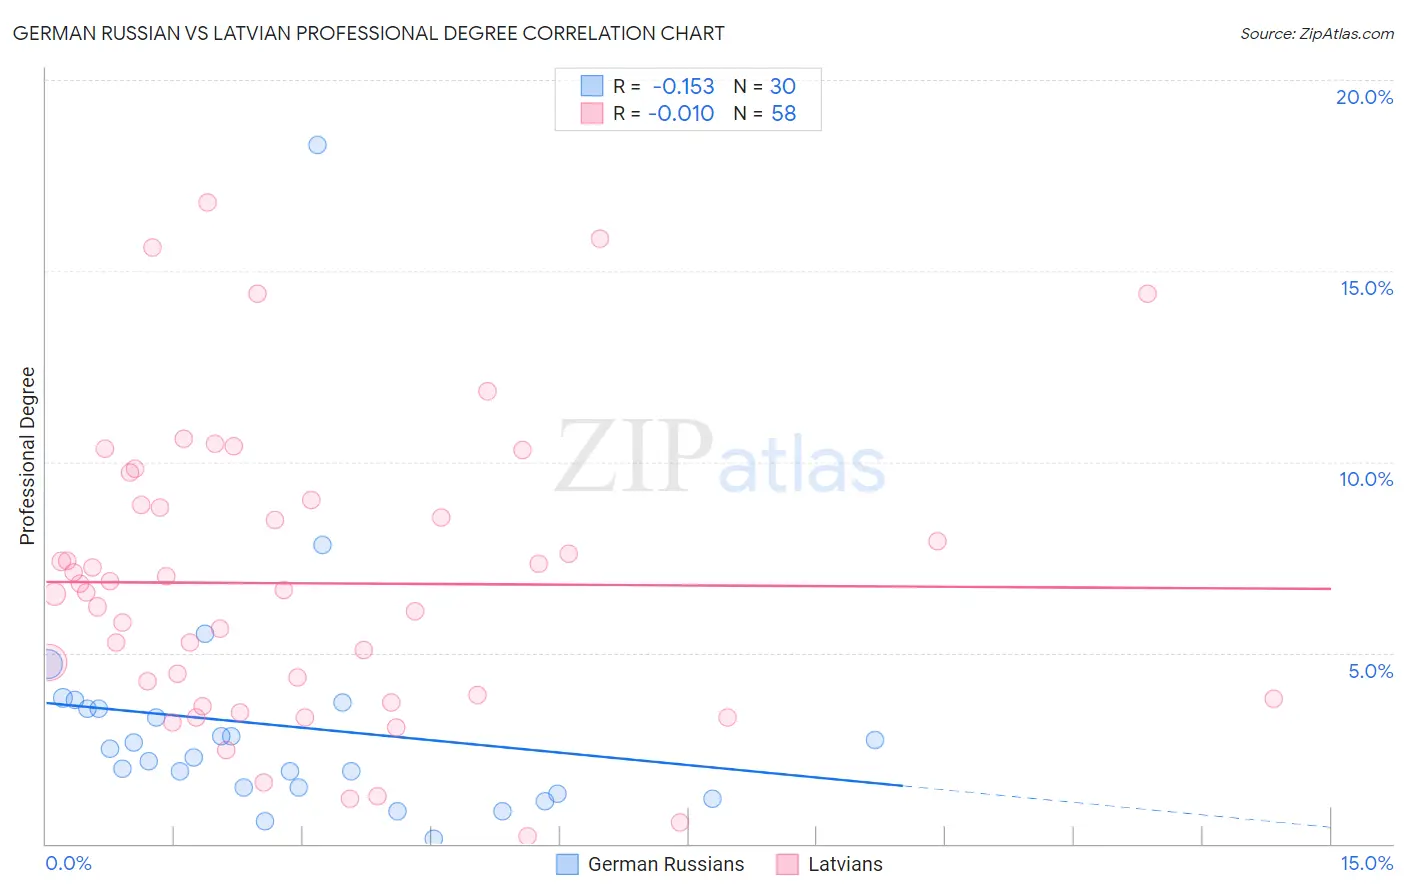
German Russian vs Latvian Professional Degree Correlation Chart
The statistical analysis conducted on geographies consisting of 96,360,992 people shows a poor negative correlation between the proportion of German Russians and percentage of population with at least professional degree education in the United States with a correlation coefficient (R) of -0.153 and weighted average of 4.0%. Similarly, the statistical analysis conducted on geographies consisting of 220,543,521 people shows no correlation between the proportion of Latvians and percentage of population with at least professional degree education in the United States with a correlation coefficient (R) of -0.010 and weighted average of 6.2%, a difference of 57.4%.
Professional Degree Correlation Summary
| Measurement | German Russian | Latvian |
| Minimum | 0.15% | 0.19% |
| Maximum | 18.3% | 16.8% |
| Range | 18.2% | 16.6% |
| Mean | 3.1% | 6.8% |
| Median | 2.4% | 6.6% |
| Interquartile 25% (IQ1) | 1.5% | 3.8% |
| Interquartile 75% (IQ3) | 3.6% | 8.9% |
| Interquartile Range (IQR) | 2.1% | 5.1% |
| Standard Deviation (Sample) | 3.3% | 3.8% |
| Standard Deviation (Population) | 3.2% | 3.8% |
Similar Demographics by Professional Degree
Demographics Similar to German Russians by Professional Degree
In terms of professional degree, the demographic groups most similar to German Russians are Cuban (4.0%, a difference of 0.12%), Immigrants from West Indies (4.0%, a difference of 0.37%), Immigrants from Burma/Myanmar (3.9%, a difference of 0.52%), Tlingit-Haida (4.0%, a difference of 0.55%), and Trinidadian and Tobagonian (4.0%, a difference of 0.68%).
| Demographics | Rating | Rank | Professional Degree |
| Immigrants | South Eastern Asia | 8.9 /100 | #219 | Tragic 4.0% |
| Ute | 8.2 /100 | #220 | Tragic 4.0% |
| French Canadians | 8.0 /100 | #221 | Tragic 4.0% |
| Immigrants | Western Africa | 7.5 /100 | #222 | Tragic 4.0% |
| Immigrants | Bosnia and Herzegovina | 7.4 /100 | #223 | Tragic 4.0% |
| Trinidadians and Tobagonians | 7.1 /100 | #224 | Tragic 4.0% |
| Tlingit-Haida | 6.9 /100 | #225 | Tragic 4.0% |
| German Russians | 6.1 /100 | #226 | Tragic 4.0% |
| Cubans | 5.9 /100 | #227 | Tragic 4.0% |
| Immigrants | West Indies | 5.6 /100 | #228 | Tragic 4.0% |
| Immigrants | Burma/Myanmar | 5.4 /100 | #229 | Tragic 3.9% |
| Nicaraguans | 5.1 /100 | #230 | Tragic 3.9% |
| Ecuadorians | 4.6 /100 | #231 | Tragic 3.9% |
| Cree | 4.3 /100 | #232 | Tragic 3.9% |
| Immigrants | Philippines | 4.1 /100 | #233 | Tragic 3.9% |
Demographics Similar to Latvians by Professional Degree
In terms of professional degree, the demographic groups most similar to Latvians are Immigrants from Northern Europe (6.2%, a difference of 0.50%), Turkish (6.2%, a difference of 0.62%), Immigrants from Ireland (6.3%, a difference of 0.88%), Immigrants from Sri Lanka (6.2%, a difference of 1.3%), and Immigrants from Turkey (6.2%, a difference of 1.3%).
| Demographics | Rating | Rank | Professional Degree |
| Indians (Asian) | 100.0 /100 | #19 | Exceptional 6.5% |
| Immigrants | Denmark | 100.0 /100 | #20 | Exceptional 6.4% |
| Immigrants | Hong Kong | 100.0 /100 | #21 | Exceptional 6.4% |
| Immigrants | Japan | 100.0 /100 | #22 | Exceptional 6.4% |
| Russians | 100.0 /100 | #23 | Exceptional 6.3% |
| Immigrants | Spain | 100.0 /100 | #24 | Exceptional 6.3% |
| Immigrants | Ireland | 100.0 /100 | #25 | Exceptional 6.3% |
| Latvians | 100.0 /100 | #26 | Exceptional 6.2% |
| Immigrants | Northern Europe | 100.0 /100 | #27 | Exceptional 6.2% |
| Turks | 100.0 /100 | #28 | Exceptional 6.2% |
| Immigrants | Sri Lanka | 100.0 /100 | #29 | Exceptional 6.2% |
| Immigrants | Turkey | 100.0 /100 | #30 | Exceptional 6.2% |
| Immigrants | India | 100.0 /100 | #31 | Exceptional 6.2% |
| Thais | 100.0 /100 | #32 | Exceptional 6.1% |
| Burmese | 100.0 /100 | #33 | Exceptional 6.1% |