German Russian vs Crow Professional Degree
COMPARE
German Russian
Crow
Professional Degree
Professional Degree Comparison
German Russians
Crow
4.0%
PROFESSIONAL DEGREE
6.1/ 100
METRIC RATING
226th/ 347
METRIC RANK
3.2%
PROFESSIONAL DEGREE
0.0/ 100
METRIC RATING
324th/ 347
METRIC RANK
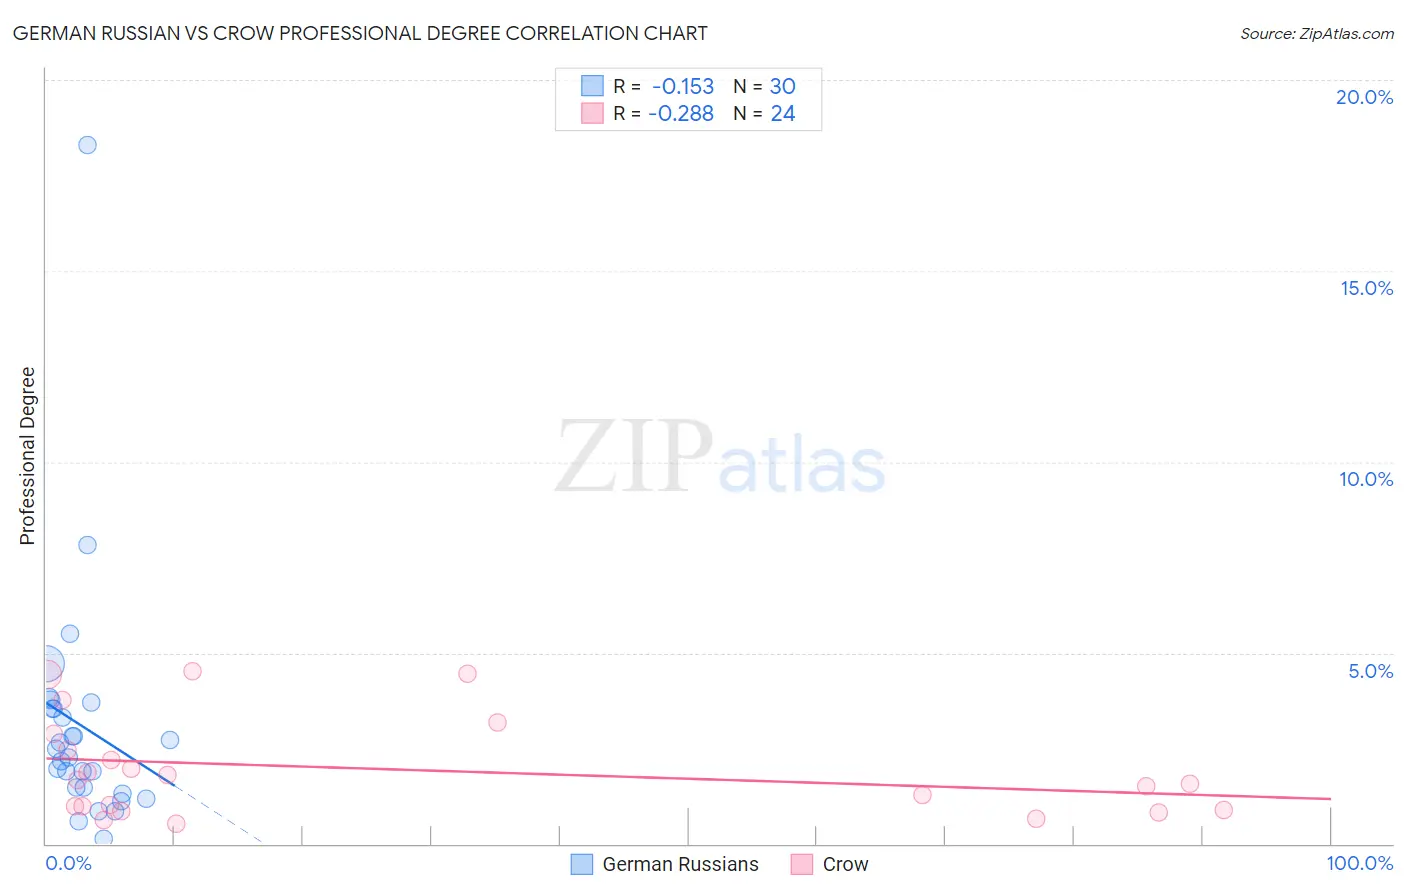
German Russian vs Crow Professional Degree Correlation Chart
The statistical analysis conducted on geographies consisting of 96,360,992 people shows a poor negative correlation between the proportion of German Russians and percentage of population with at least professional degree education in the United States with a correlation coefficient (R) of -0.153 and weighted average of 4.0%. Similarly, the statistical analysis conducted on geographies consisting of 59,107,625 people shows a weak negative correlation between the proportion of Crow and percentage of population with at least professional degree education in the United States with a correlation coefficient (R) of -0.288 and weighted average of 3.2%, a difference of 25.7%.
Professional Degree Correlation Summary
| Measurement | German Russian | Crow |
| Minimum | 0.15% | 0.53% |
| Maximum | 18.3% | 4.5% |
| Range | 18.2% | 4.0% |
| Mean | 3.1% | 2.0% |
| Median | 2.4% | 1.6% |
| Interquartile 25% (IQ1) | 1.5% | 0.93% |
| Interquartile 75% (IQ3) | 3.6% | 2.7% |
| Interquartile Range (IQR) | 2.1% | 1.7% |
| Standard Deviation (Sample) | 3.3% | 1.3% |
| Standard Deviation (Population) | 3.2% | 1.3% |
Similar Demographics by Professional Degree
Demographics Similar to German Russians by Professional Degree
In terms of professional degree, the demographic groups most similar to German Russians are Cuban (4.0%, a difference of 0.12%), Immigrants from West Indies (4.0%, a difference of 0.37%), Immigrants from Burma/Myanmar (3.9%, a difference of 0.52%), Tlingit-Haida (4.0%, a difference of 0.55%), and Trinidadian and Tobagonian (4.0%, a difference of 0.68%).
| Demographics | Rating | Rank | Professional Degree |
| Immigrants | South Eastern Asia | 8.9 /100 | #219 | Tragic 4.0% |
| Ute | 8.2 /100 | #220 | Tragic 4.0% |
| French Canadians | 8.0 /100 | #221 | Tragic 4.0% |
| Immigrants | Western Africa | 7.5 /100 | #222 | Tragic 4.0% |
| Immigrants | Bosnia and Herzegovina | 7.4 /100 | #223 | Tragic 4.0% |
| Trinidadians and Tobagonians | 7.1 /100 | #224 | Tragic 4.0% |
| Tlingit-Haida | 6.9 /100 | #225 | Tragic 4.0% |
| German Russians | 6.1 /100 | #226 | Tragic 4.0% |
| Cubans | 5.9 /100 | #227 | Tragic 4.0% |
| Immigrants | West Indies | 5.6 /100 | #228 | Tragic 4.0% |
| Immigrants | Burma/Myanmar | 5.4 /100 | #229 | Tragic 3.9% |
| Nicaraguans | 5.1 /100 | #230 | Tragic 3.9% |
| Ecuadorians | 4.6 /100 | #231 | Tragic 3.9% |
| Cree | 4.3 /100 | #232 | Tragic 3.9% |
| Immigrants | Philippines | 4.1 /100 | #233 | Tragic 3.9% |
Demographics Similar to Crow by Professional Degree
In terms of professional degree, the demographic groups most similar to Crow are Yaqui (3.2%, a difference of 0.060%), Inupiat (3.2%, a difference of 0.27%), Hispanic or Latino (3.2%, a difference of 0.35%), Tsimshian (3.2%, a difference of 0.72%), and Seminole (3.2%, a difference of 1.1%).
| Demographics | Rating | Rank | Professional Degree |
| Nepalese | 0.1 /100 | #317 | Tragic 3.2% |
| Immigrants | Micronesia | 0.1 /100 | #318 | Tragic 3.2% |
| Choctaw | 0.1 /100 | #319 | Tragic 3.2% |
| Seminole | 0.1 /100 | #320 | Tragic 3.2% |
| Tsimshian | 0.0 /100 | #321 | Tragic 3.2% |
| Hispanics or Latinos | 0.0 /100 | #322 | Tragic 3.2% |
| Inupiat | 0.0 /100 | #323 | Tragic 3.2% |
| Crow | 0.0 /100 | #324 | Tragic 3.2% |
| Yaqui | 0.0 /100 | #325 | Tragic 3.2% |
| Menominee | 0.0 /100 | #326 | Tragic 3.1% |
| Dutch West Indians | 0.0 /100 | #327 | Tragic 3.1% |
| Creek | 0.0 /100 | #328 | Tragic 3.1% |
| Bangladeshis | 0.0 /100 | #329 | Tragic 3.1% |
| Immigrants | Cabo Verde | 0.0 /100 | #330 | Tragic 3.1% |
| Kiowa | 0.0 /100 | #331 | Tragic 3.1% |