French vs Immigrants from Serbia Associate's Degree
COMPARE
French
Immigrants from Serbia
Associate's Degree
Associate's Degree Comparison
French
Immigrants from Serbia
45.4%
ASSOCIATE'S DEGREE
25.6/ 100
METRIC RATING
196th/ 347
METRIC RANK
51.7%
ASSOCIATE'S DEGREE
99.8/ 100
METRIC RATING
59th/ 347
METRIC RANK
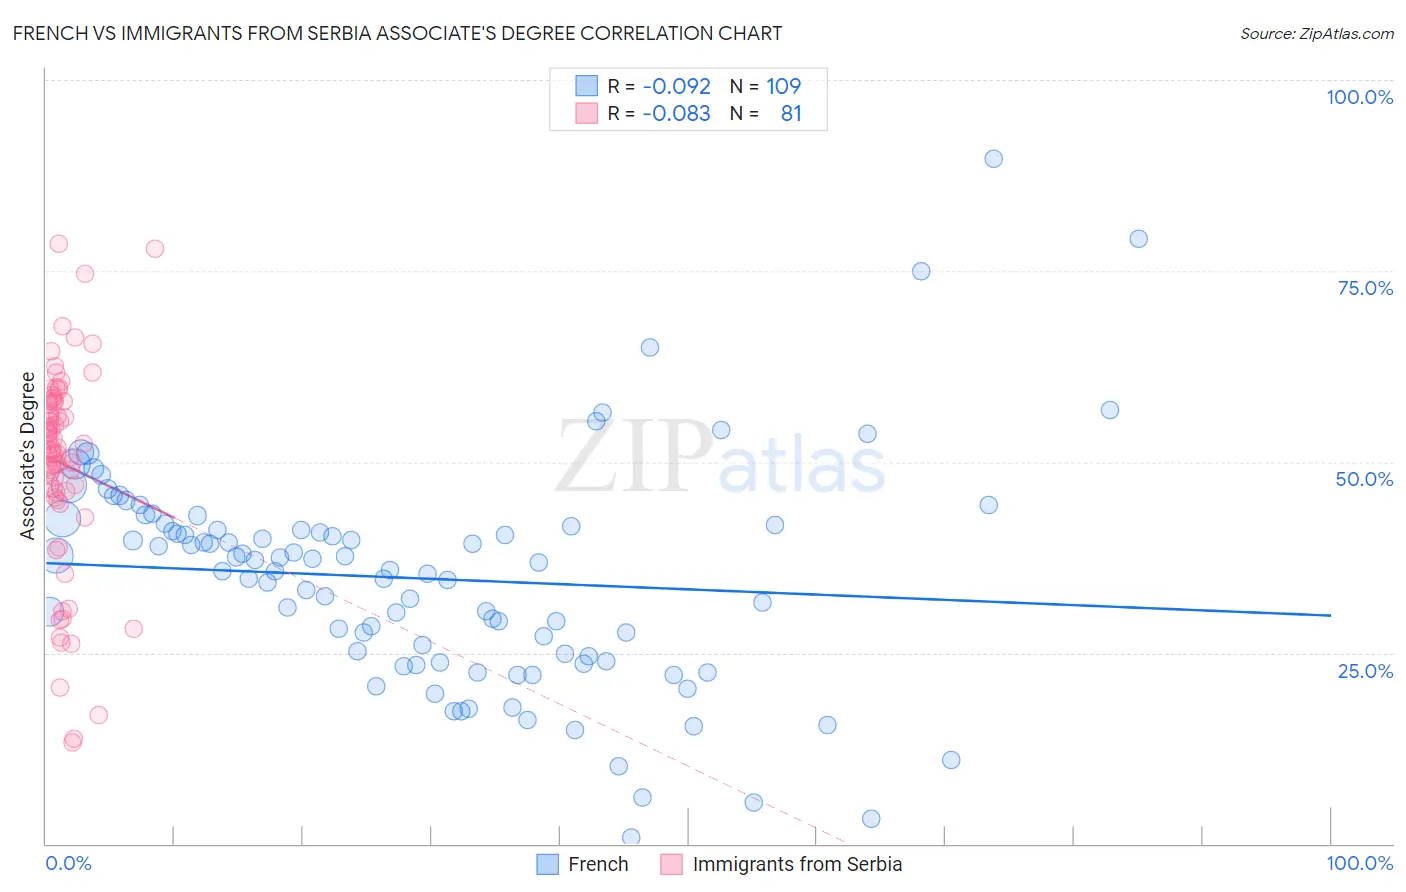
French vs Immigrants from Serbia Associate's Degree Correlation Chart
The statistical analysis conducted on geographies consisting of 572,343,340 people shows a slight negative correlation between the proportion of French and percentage of population with at least associate's degree education in the United States with a correlation coefficient (R) of -0.092 and weighted average of 45.4%. Similarly, the statistical analysis conducted on geographies consisting of 131,744,029 people shows a slight negative correlation between the proportion of Immigrants from Serbia and percentage of population with at least associate's degree education in the United States with a correlation coefficient (R) of -0.083 and weighted average of 51.7%, a difference of 13.9%.
Associate's Degree Correlation Summary
| Measurement | French | Immigrants from Serbia |
| Minimum | 0.78% | 13.2% |
| Maximum | 89.7% | 78.6% |
| Range | 88.9% | 65.4% |
| Mean | 34.7% | 49.8% |
| Median | 35.9% | 51.9% |
| Interquartile 25% (IQ1) | 24.2% | 46.1% |
| Interquartile 75% (IQ3) | 41.7% | 57.9% |
| Interquartile Range (IQR) | 17.5% | 11.8% |
| Standard Deviation (Sample) | 14.6% | 13.3% |
| Standard Deviation (Population) | 14.6% | 13.2% |
Similar Demographics by Associate's Degree
Demographics Similar to French by Associate's Degree
In terms of associate's degree, the demographic groups most similar to French are German (45.5%, a difference of 0.090%), Immigrants from Peru (45.5%, a difference of 0.19%), Scotch-Irish (45.3%, a difference of 0.35%), Immigrants from Bangladesh (45.2%, a difference of 0.45%), and Immigrants from Senegal (45.2%, a difference of 0.47%).
| Demographics | Rating | Rank | Associate's Degree |
| Immigrants | Oceania | 34.7 /100 | #189 | Fair 45.8% |
| Vietnamese | 34.0 /100 | #190 | Fair 45.8% |
| Koreans | 33.8 /100 | #191 | Fair 45.8% |
| Celtics | 33.3 /100 | #192 | Fair 45.8% |
| Immigrants | Cameroon | 31.0 /100 | #193 | Fair 45.7% |
| Immigrants | Peru | 27.6 /100 | #194 | Fair 45.5% |
| Germans | 26.5 /100 | #195 | Fair 45.5% |
| French | 25.6 /100 | #196 | Fair 45.4% |
| Scotch-Irish | 22.3 /100 | #197 | Fair 45.3% |
| Immigrants | Bangladesh | 21.3 /100 | #198 | Fair 45.2% |
| Immigrants | Senegal | 21.2 /100 | #199 | Fair 45.2% |
| Senegalese | 21.1 /100 | #200 | Fair 45.2% |
| Immigrants | Vietnam | 20.8 /100 | #201 | Fair 45.2% |
| Spaniards | 20.4 /100 | #202 | Fair 45.2% |
| Immigrants | South Eastern Asia | 20.2 /100 | #203 | Fair 45.2% |
Demographics Similar to Immigrants from Serbia by Associate's Degree
In terms of associate's degree, the demographic groups most similar to Immigrants from Serbia are New Zealander (51.8%, a difference of 0.13%), Paraguayan (51.8%, a difference of 0.16%), Immigrants from Czechoslovakia (51.9%, a difference of 0.28%), Australian (51.9%, a difference of 0.30%), and Immigrants from Spain (51.9%, a difference of 0.33%).
| Demographics | Rating | Rank | Associate's Degree |
| Bolivians | 99.8 /100 | #52 | Exceptional 52.0% |
| Immigrants | Asia | 99.8 /100 | #53 | Exceptional 52.0% |
| Immigrants | Spain | 99.8 /100 | #54 | Exceptional 51.9% |
| Australians | 99.8 /100 | #55 | Exceptional 51.9% |
| Immigrants | Czechoslovakia | 99.8 /100 | #56 | Exceptional 51.9% |
| Paraguayans | 99.8 /100 | #57 | Exceptional 51.8% |
| New Zealanders | 99.8 /100 | #58 | Exceptional 51.8% |
| Immigrants | Serbia | 99.8 /100 | #59 | Exceptional 51.7% |
| Immigrants | Bolivia | 99.7 /100 | #60 | Exceptional 51.5% |
| Immigrants | Kazakhstan | 99.7 /100 | #61 | Exceptional 51.4% |
| Bhutanese | 99.7 /100 | #62 | Exceptional 51.4% |
| South Africans | 99.7 /100 | #63 | Exceptional 51.4% |
| Immigrants | Netherlands | 99.7 /100 | #64 | Exceptional 51.4% |
| Zimbabweans | 99.7 /100 | #65 | Exceptional 51.3% |
| Immigrants | Europe | 99.7 /100 | #66 | Exceptional 51.3% |