French vs Cherokee Associate's Degree
COMPARE
French
Cherokee
Associate's Degree
Associate's Degree Comparison
French
Cherokee
45.4%
ASSOCIATE'S DEGREE
25.6/ 100
METRIC RATING
196th/ 347
METRIC RANK
38.9%
ASSOCIATE'S DEGREE
0.0/ 100
METRIC RATING
296th/ 347
METRIC RANK
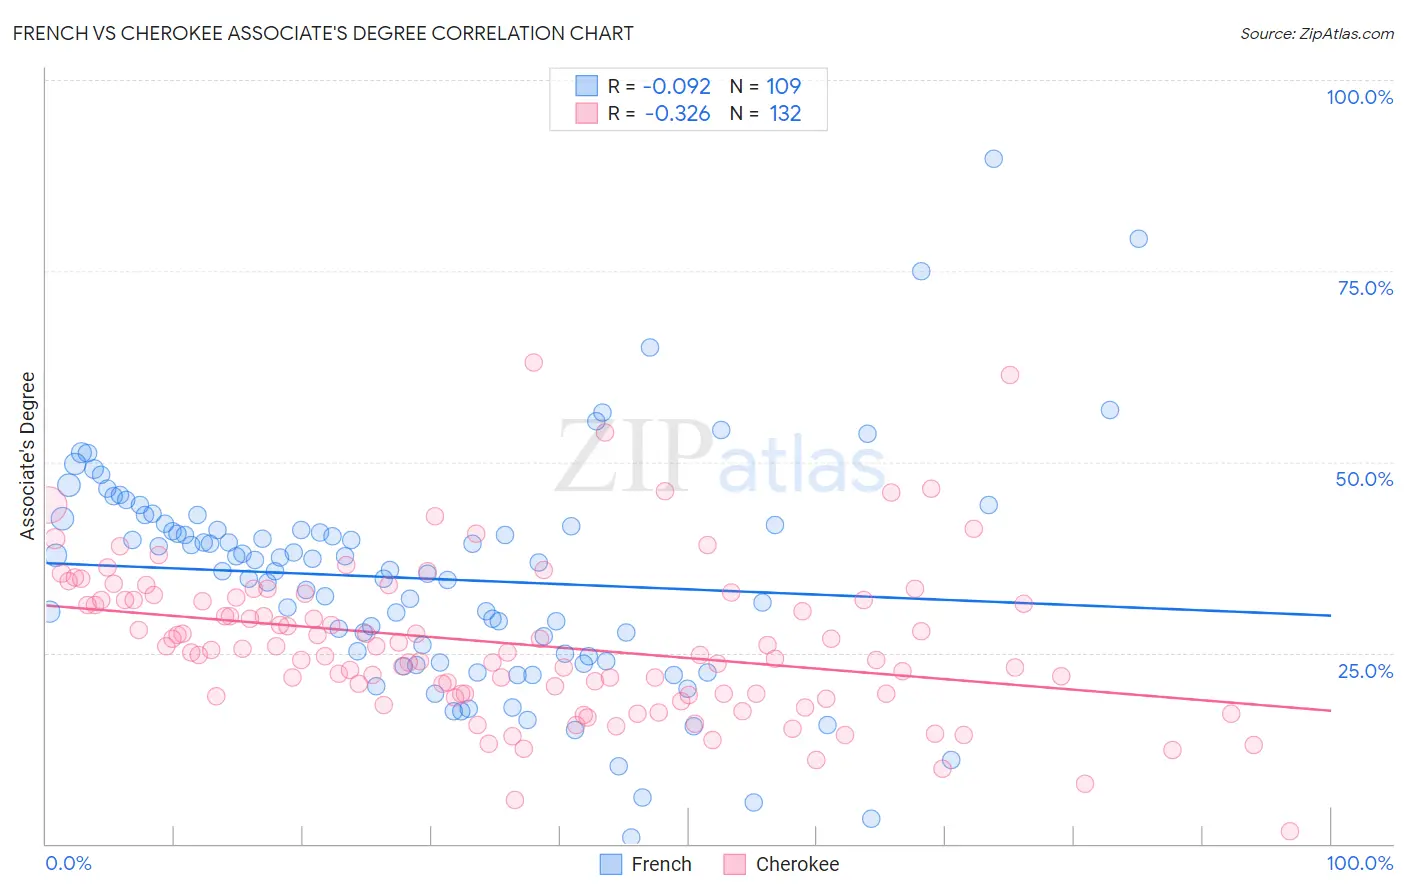
French vs Cherokee Associate's Degree Correlation Chart
The statistical analysis conducted on geographies consisting of 572,343,340 people shows a slight negative correlation between the proportion of French and percentage of population with at least associate's degree education in the United States with a correlation coefficient (R) of -0.092 and weighted average of 45.4%. Similarly, the statistical analysis conducted on geographies consisting of 493,690,336 people shows a mild negative correlation between the proportion of Cherokee and percentage of population with at least associate's degree education in the United States with a correlation coefficient (R) of -0.326 and weighted average of 38.9%, a difference of 16.9%.
Associate's Degree Correlation Summary
| Measurement | French | Cherokee |
| Minimum | 0.78% | 1.6% |
| Maximum | 89.7% | 63.1% |
| Range | 88.9% | 61.4% |
| Mean | 34.7% | 26.2% |
| Median | 35.9% | 25.3% |
| Interquartile 25% (IQ1) | 24.2% | 19.6% |
| Interquartile 75% (IQ3) | 41.7% | 31.9% |
| Interquartile Range (IQR) | 17.5% | 12.3% |
| Standard Deviation (Sample) | 14.6% | 10.0% |
| Standard Deviation (Population) | 14.6% | 10.0% |
Similar Demographics by Associate's Degree
Demographics Similar to French by Associate's Degree
In terms of associate's degree, the demographic groups most similar to French are German (45.5%, a difference of 0.090%), Immigrants from Peru (45.5%, a difference of 0.19%), Scotch-Irish (45.3%, a difference of 0.35%), Immigrants from Bangladesh (45.2%, a difference of 0.45%), and Immigrants from Senegal (45.2%, a difference of 0.47%).
| Demographics | Rating | Rank | Associate's Degree |
| Immigrants | Oceania | 34.7 /100 | #189 | Fair 45.8% |
| Vietnamese | 34.0 /100 | #190 | Fair 45.8% |
| Koreans | 33.8 /100 | #191 | Fair 45.8% |
| Celtics | 33.3 /100 | #192 | Fair 45.8% |
| Immigrants | Cameroon | 31.0 /100 | #193 | Fair 45.7% |
| Immigrants | Peru | 27.6 /100 | #194 | Fair 45.5% |
| Germans | 26.5 /100 | #195 | Fair 45.5% |
| French | 25.6 /100 | #196 | Fair 45.4% |
| Scotch-Irish | 22.3 /100 | #197 | Fair 45.3% |
| Immigrants | Bangladesh | 21.3 /100 | #198 | Fair 45.2% |
| Immigrants | Senegal | 21.2 /100 | #199 | Fair 45.2% |
| Senegalese | 21.1 /100 | #200 | Fair 45.2% |
| Immigrants | Vietnam | 20.8 /100 | #201 | Fair 45.2% |
| Spaniards | 20.4 /100 | #202 | Fair 45.2% |
| Immigrants | South Eastern Asia | 20.2 /100 | #203 | Fair 45.2% |
Demographics Similar to Cherokee by Associate's Degree
In terms of associate's degree, the demographic groups most similar to Cherokee are Honduran (38.9%, a difference of 0.17%), Cape Verdean (38.8%, a difference of 0.28%), Nepalese (39.0%, a difference of 0.46%), Salvadoran (39.0%, a difference of 0.46%), and Cheyenne (38.7%, a difference of 0.55%).
| Demographics | Rating | Rank | Associate's Degree |
| Central Americans | 0.0 /100 | #289 | Tragic 39.4% |
| Immigrants | Haiti | 0.0 /100 | #290 | Tragic 39.3% |
| Dominicans | 0.0 /100 | #291 | Tragic 39.3% |
| Blacks/African Americans | 0.0 /100 | #292 | Tragic 39.1% |
| Nepalese | 0.0 /100 | #293 | Tragic 39.0% |
| Salvadorans | 0.0 /100 | #294 | Tragic 39.0% |
| Hondurans | 0.0 /100 | #295 | Tragic 38.9% |
| Cherokee | 0.0 /100 | #296 | Tragic 38.9% |
| Cape Verdeans | 0.0 /100 | #297 | Tragic 38.8% |
| Cheyenne | 0.0 /100 | #298 | Tragic 38.7% |
| Ute | 0.0 /100 | #299 | Tragic 38.6% |
| Chickasaw | 0.0 /100 | #300 | Tragic 38.6% |
| Tsimshian | 0.0 /100 | #301 | Tragic 38.6% |
| Colville | 0.0 /100 | #302 | Tragic 38.5% |
| Guatemalans | 0.0 /100 | #303 | Tragic 38.5% |